Immigrants from North America vs Immigrants from Bosnia and Herzegovina 4 or more Vehicles in Household
COMPARE
Immigrants from North America
Immigrants from Bosnia and Herzegovina
4 or more Vehicles in Household
4 or more Vehicles in Household Comparison
Immigrants from North America
Immigrants from Bosnia and Herzegovina
6.5%
4 OR MORE VEHICLES IN HOUSEHOLD
78.5/ 100
METRIC RATING
144th/ 347
METRIC RANK
5.3%
4 OR MORE VEHICLES IN HOUSEHOLD
0.2/ 100
METRIC RATING
289th/ 347
METRIC RANK
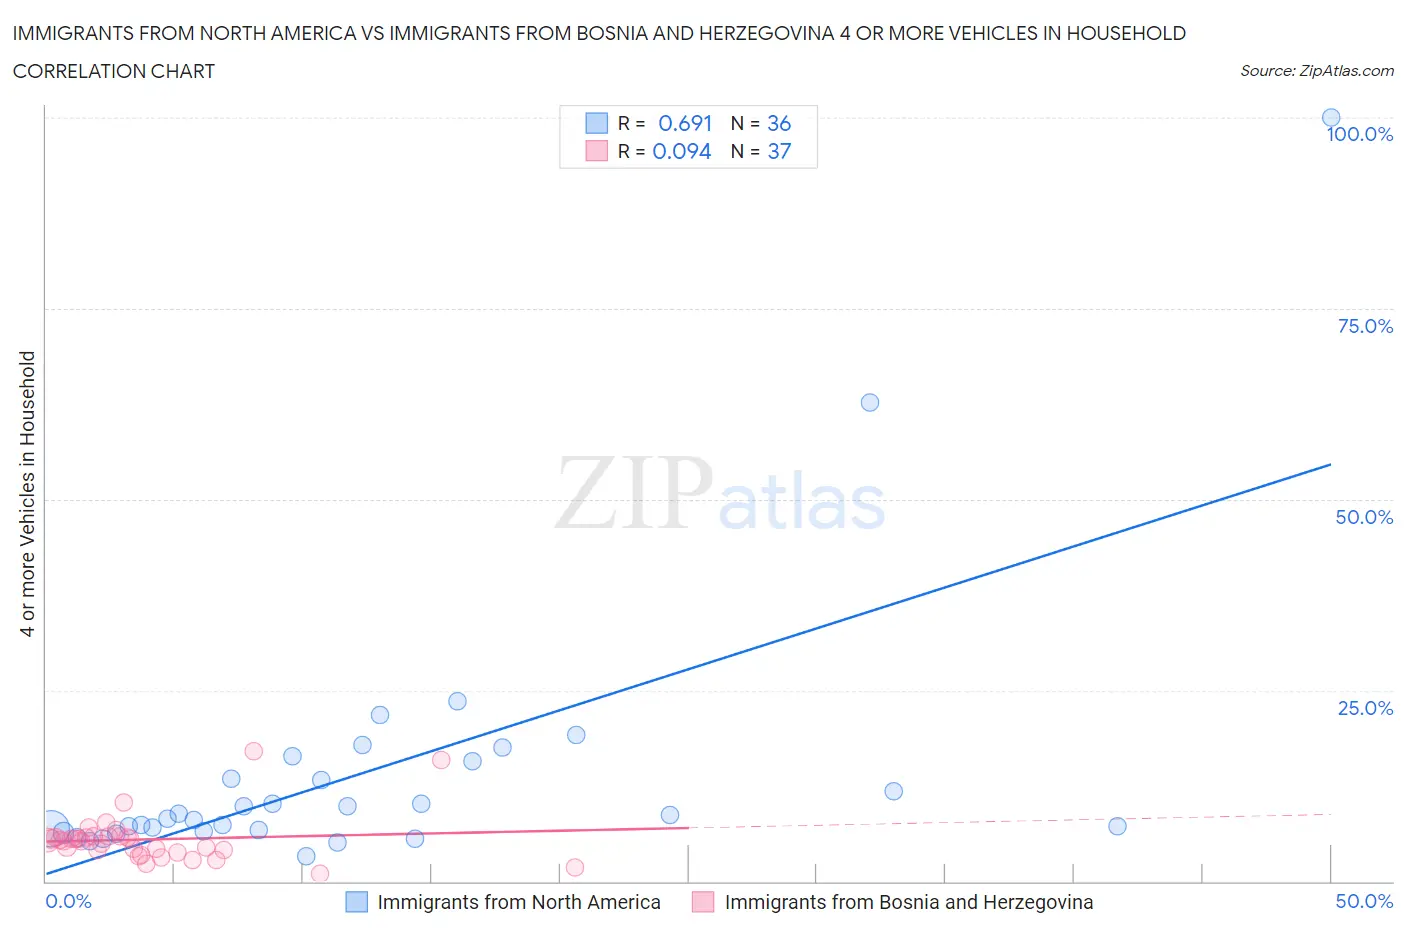
Immigrants from North America vs Immigrants from Bosnia and Herzegovina 4 or more Vehicles in Household Correlation Chart
The statistical analysis conducted on geographies consisting of 460,242,887 people shows a significant positive correlation between the proportion of Immigrants from North America and percentage of households with 4 or more vehicles available in the United States with a correlation coefficient (R) of 0.691 and weighted average of 6.5%. Similarly, the statistical analysis conducted on geographies consisting of 156,484,341 people shows a slight positive correlation between the proportion of Immigrants from Bosnia and Herzegovina and percentage of households with 4 or more vehicles available in the United States with a correlation coefficient (R) of 0.094 and weighted average of 5.3%, a difference of 22.5%.
4 or more Vehicles in Household Correlation Summary
| Measurement | Immigrants from North America | Immigrants from Bosnia and Herzegovina |
| Minimum | 3.3% | 0.96% |
| Maximum | 100.0% | 17.0% |
| Range | 96.7% | 16.0% |
| Mean | 14.1% | 5.5% |
| Median | 8.4% | 5.4% |
| Interquartile 25% (IQ1) | 6.7% | 3.9% |
| Interquartile 75% (IQ3) | 14.6% | 5.8% |
| Interquartile Range (IQR) | 7.9% | 1.9% |
| Standard Deviation (Sample) | 17.9% | 3.2% |
| Standard Deviation (Population) | 17.6% | 3.1% |
Similar Demographics by 4 or more Vehicles in Household
Demographics Similar to Immigrants from North America by 4 or more Vehicles in Household
In terms of 4 or more vehicles in household, the demographic groups most similar to Immigrants from North America are Immigrants from Canada (6.5%, a difference of 0.020%), Croatian (6.5%, a difference of 0.10%), Immigrants from Iraq (6.5%, a difference of 0.15%), Australian (6.6%, a difference of 0.35%), and Slavic (6.6%, a difference of 0.48%).
| Demographics | Rating | Rank | 4 or more Vehicles in Household |
| French Canadians | 85.4 /100 | #137 | Excellent 6.6% |
| Italians | 84.5 /100 | #138 | Excellent 6.6% |
| Jordanians | 82.1 /100 | #139 | Excellent 6.6% |
| Slavs | 81.6 /100 | #140 | Excellent 6.6% |
| Australians | 80.8 /100 | #141 | Excellent 6.6% |
| Immigrants | Iraq | 79.4 /100 | #142 | Good 6.5% |
| Immigrants | Canada | 78.6 /100 | #143 | Good 6.5% |
| Immigrants | North America | 78.5 /100 | #144 | Good 6.5% |
| Croatians | 77.8 /100 | #145 | Good 6.5% |
| Immigrants | Costa Rica | 74.4 /100 | #146 | Good 6.5% |
| Immigrants | Iran | 73.9 /100 | #147 | Good 6.5% |
| Immigrants | Jordan | 73.7 /100 | #148 | Good 6.5% |
| Greeks | 73.6 /100 | #149 | Good 6.5% |
| New Zealanders | 73.3 /100 | #150 | Good 6.5% |
| Immigrants | Hong Kong | 72.2 /100 | #151 | Good 6.5% |
Demographics Similar to Immigrants from Bosnia and Herzegovina by 4 or more Vehicles in Household
In terms of 4 or more vehicles in household, the demographic groups most similar to Immigrants from Bosnia and Herzegovina are Venezuelan (5.3%, a difference of 0.14%), Immigrants from Russia (5.3%, a difference of 0.30%), Immigrants from Croatia (5.4%, a difference of 0.33%), Immigrants from Colombia (5.4%, a difference of 0.42%), and Immigrants from Liberia (5.4%, a difference of 0.46%).
| Demographics | Rating | Rank | 4 or more Vehicles in Household |
| Immigrants | Spain | 0.3 /100 | #282 | Tragic 5.4% |
| Immigrants | Ireland | 0.3 /100 | #283 | Tragic 5.4% |
| Brazilians | 0.3 /100 | #284 | Tragic 5.4% |
| Immigrants | Liberia | 0.2 /100 | #285 | Tragic 5.4% |
| Immigrants | Colombia | 0.2 /100 | #286 | Tragic 5.4% |
| Immigrants | Croatia | 0.2 /100 | #287 | Tragic 5.4% |
| Venezuelans | 0.2 /100 | #288 | Tragic 5.3% |
| Immigrants | Bosnia and Herzegovina | 0.2 /100 | #289 | Tragic 5.3% |
| Immigrants | Russia | 0.2 /100 | #290 | Tragic 5.3% |
| Immigrants | Bahamas | 0.1 /100 | #291 | Tragic 5.3% |
| Liberians | 0.1 /100 | #292 | Tragic 5.3% |
| Immigrants | Congo | 0.1 /100 | #293 | Tragic 5.2% |
| Ghanaians | 0.1 /100 | #294 | Tragic 5.2% |
| Immigrants | Brazil | 0.1 /100 | #295 | Tragic 5.2% |
| Israelis | 0.1 /100 | #296 | Tragic 5.2% |