Immigrants from Netherlands vs Irish 1 or more Vehicles in Household
COMPARE
Immigrants from Netherlands
Irish
1 or more Vehicles in Household
1 or more Vehicles in Household Comparison
Immigrants from Netherlands
Irish
90.8%
1 OR MORE VEHICLES IN HOUSEHOLD
95.7/ 100
METRIC RATING
112th/ 347
METRIC RANK
93.1%
1 OR MORE VEHICLES IN HOUSEHOLD
100.0/ 100
METRIC RATING
14th/ 347
METRIC RANK
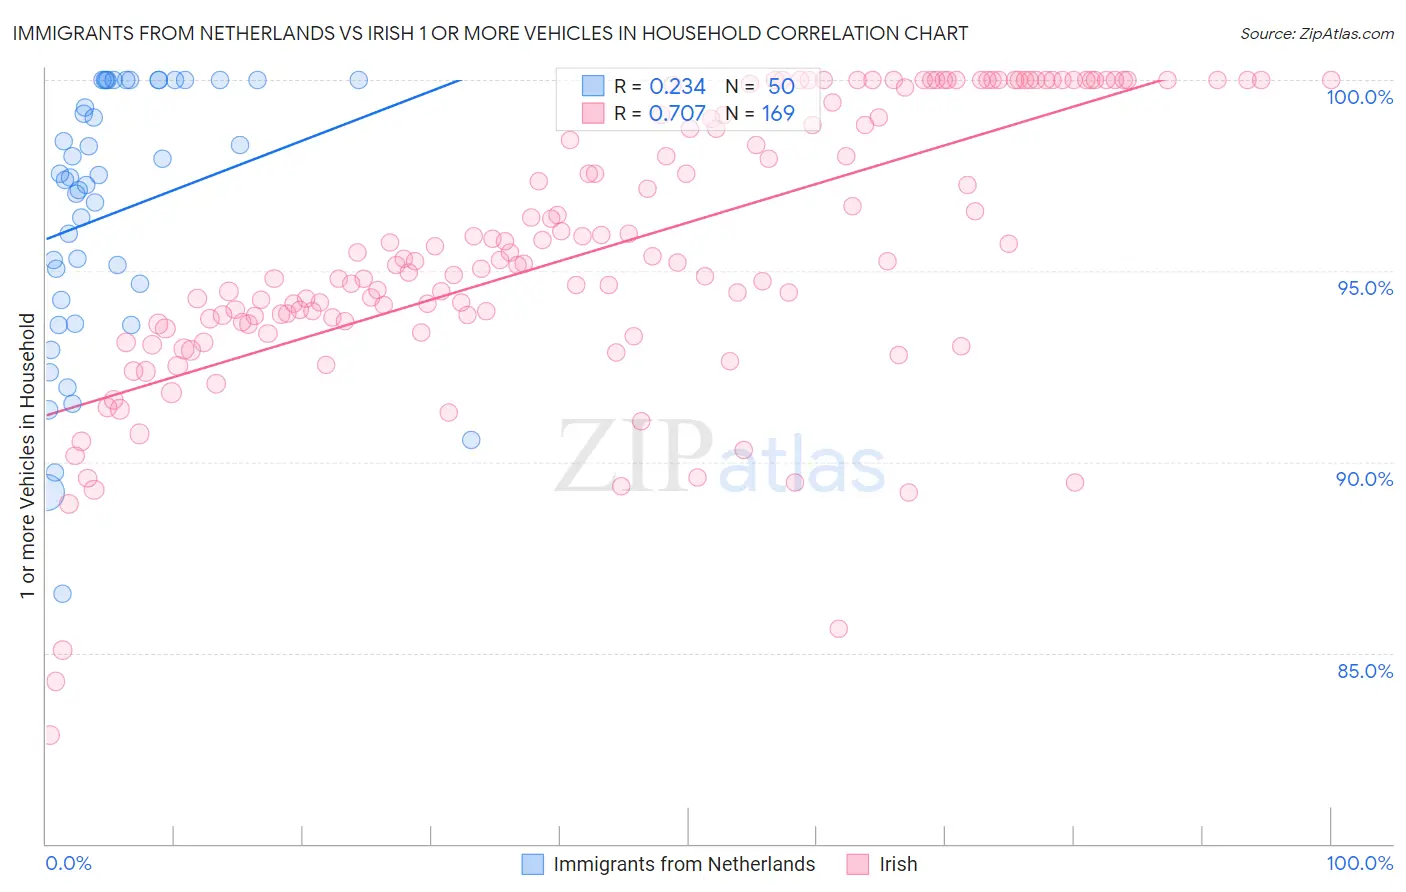
Immigrants from Netherlands vs Irish 1 or more Vehicles in Household Correlation Chart
The statistical analysis conducted on geographies consisting of 237,818,217 people shows a weak positive correlation between the proportion of Immigrants from Netherlands and percentage of households with 1 or more vehicles available in the United States with a correlation coefficient (R) of 0.234 and weighted average of 90.8%. Similarly, the statistical analysis conducted on geographies consisting of 554,668,080 people shows a strong positive correlation between the proportion of Irish and percentage of households with 1 or more vehicles available in the United States with a correlation coefficient (R) of 0.707 and weighted average of 93.1%, a difference of 2.5%.
1 or more Vehicles in Household Correlation Summary
| Measurement | Immigrants from Netherlands | Irish |
| Minimum | 86.5% | 82.8% |
| Maximum | 100.0% | 100.0% |
| Range | 13.5% | 17.2% |
| Mean | 96.5% | 95.6% |
| Median | 97.4% | 95.2% |
| Interquartile 25% (IQ1) | 94.2% | 93.6% |
| Interquartile 75% (IQ3) | 100.0% | 99.6% |
| Interquartile Range (IQR) | 5.8% | 6.0% |
| Standard Deviation (Sample) | 3.5% | 3.6% |
| Standard Deviation (Population) | 3.4% | 3.6% |
Similar Demographics by 1 or more Vehicles in Household
Demographics Similar to Immigrants from Netherlands by 1 or more Vehicles in Household
In terms of 1 or more vehicles in household, the demographic groups most similar to Immigrants from Netherlands are Navajo (90.8%, a difference of 0.010%), Immigrants from Kuwait (90.7%, a difference of 0.080%), Armenian (90.7%, a difference of 0.10%), Serbian (90.7%, a difference of 0.11%), and Chippewa (90.7%, a difference of 0.11%).
| Demographics | Rating | Rank | 1 or more Vehicles in Household |
| Laotians | 98.0 /100 | #105 | Exceptional 91.0% |
| Zimbabweans | 97.7 /100 | #106 | Exceptional 91.0% |
| Maltese | 97.7 /100 | #107 | Exceptional 91.0% |
| Hispanics or Latinos | 97.6 /100 | #108 | Exceptional 91.0% |
| Delaware | 97.6 /100 | #109 | Exceptional 91.0% |
| Mexican American Indians | 97.4 /100 | #110 | Exceptional 91.0% |
| Navajo | 95.8 /100 | #111 | Exceptional 90.8% |
| Immigrants | Netherlands | 95.7 /100 | #112 | Exceptional 90.8% |
| Immigrants | Kuwait | 94.7 /100 | #113 | Exceptional 90.7% |
| Armenians | 94.5 /100 | #114 | Exceptional 90.7% |
| Serbians | 94.3 /100 | #115 | Exceptional 90.7% |
| Chippewa | 94.3 /100 | #116 | Exceptional 90.7% |
| Greeks | 93.5 /100 | #117 | Exceptional 90.6% |
| Japanese | 93.4 /100 | #118 | Exceptional 90.6% |
| Blackfeet | 92.6 /100 | #119 | Exceptional 90.6% |
Demographics Similar to Irish by 1 or more Vehicles in Household
In terms of 1 or more vehicles in household, the demographic groups most similar to Irish are Mexican (93.0%, a difference of 0.020%), Assyrian/Chaldean/Syriac (93.0%, a difference of 0.020%), White/Caucasian (93.1%, a difference of 0.040%), European (93.0%, a difference of 0.040%), and Scandinavian (93.1%, a difference of 0.060%).
| Demographics | Rating | Rank | 1 or more Vehicles in Household |
| Scottish | 100.0 /100 | #7 | Exceptional 93.4% |
| Swedes | 100.0 /100 | #8 | Exceptional 93.3% |
| Scotch-Irish | 100.0 /100 | #9 | Exceptional 93.3% |
| Dutch | 100.0 /100 | #10 | Exceptional 93.3% |
| Czechs | 100.0 /100 | #11 | Exceptional 93.3% |
| Scandinavians | 100.0 /100 | #12 | Exceptional 93.1% |
| Whites/Caucasians | 100.0 /100 | #13 | Exceptional 93.1% |
| Irish | 100.0 /100 | #14 | Exceptional 93.1% |
| Mexicans | 100.0 /100 | #15 | Exceptional 93.0% |
| Assyrians/Chaldeans/Syriacs | 100.0 /100 | #16 | Exceptional 93.0% |
| Europeans | 100.0 /100 | #17 | Exceptional 93.0% |
| Welsh | 100.0 /100 | #18 | Exceptional 93.0% |
| Tongans | 100.0 /100 | #19 | Exceptional 92.9% |
| Arapaho | 100.0 /100 | #20 | Exceptional 92.7% |
| Ottawa | 100.0 /100 | #21 | Exceptional 92.7% |