Immigrants from Netherlands vs Bangladeshi 1 or more Vehicles in Household
COMPARE
Immigrants from Netherlands
Bangladeshi
1 or more Vehicles in Household
1 or more Vehicles in Household Comparison
Immigrants from Netherlands
Bangladeshis
90.8%
1 OR MORE VEHICLES IN HOUSEHOLD
95.7/ 100
METRIC RATING
112th/ 347
METRIC RANK
91.4%
1 OR MORE VEHICLES IN HOUSEHOLD
99.2/ 100
METRIC RATING
89th/ 347
METRIC RANK
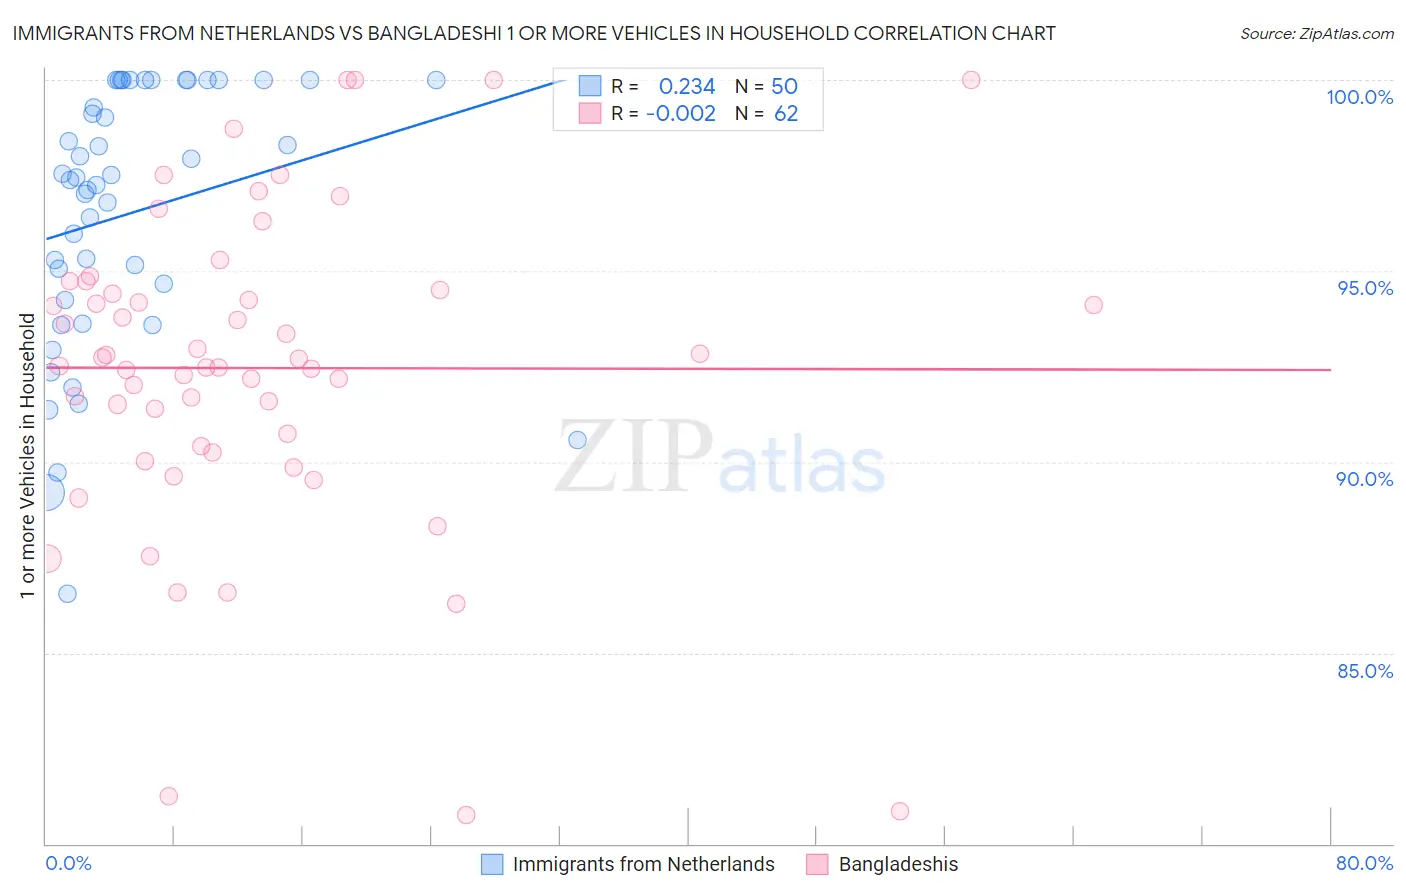
Immigrants from Netherlands vs Bangladeshi 1 or more Vehicles in Household Correlation Chart
The statistical analysis conducted on geographies consisting of 237,818,217 people shows a weak positive correlation between the proportion of Immigrants from Netherlands and percentage of households with 1 or more vehicles available in the United States with a correlation coefficient (R) of 0.234 and weighted average of 90.8%. Similarly, the statistical analysis conducted on geographies consisting of 141,361,437 people shows no correlation between the proportion of Bangladeshis and percentage of households with 1 or more vehicles available in the United States with a correlation coefficient (R) of -0.002 and weighted average of 91.4%, a difference of 0.67%.
1 or more Vehicles in Household Correlation Summary
| Measurement | Immigrants from Netherlands | Bangladeshi |
| Minimum | 86.5% | 80.7% |
| Maximum | 100.0% | 100.0% |
| Range | 13.5% | 19.3% |
| Mean | 96.5% | 92.5% |
| Median | 97.4% | 92.6% |
| Interquartile 25% (IQ1) | 94.2% | 90.4% |
| Interquartile 75% (IQ3) | 100.0% | 94.5% |
| Interquartile Range (IQR) | 5.8% | 4.1% |
| Standard Deviation (Sample) | 3.5% | 4.2% |
| Standard Deviation (Population) | 3.4% | 4.2% |
Similar Demographics by 1 or more Vehicles in Household
Demographics Similar to Immigrants from Netherlands by 1 or more Vehicles in Household
In terms of 1 or more vehicles in household, the demographic groups most similar to Immigrants from Netherlands are Navajo (90.8%, a difference of 0.010%), Immigrants from Kuwait (90.7%, a difference of 0.080%), Armenian (90.7%, a difference of 0.10%), Serbian (90.7%, a difference of 0.11%), and Chippewa (90.7%, a difference of 0.11%).
| Demographics | Rating | Rank | 1 or more Vehicles in Household |
| Laotians | 98.0 /100 | #105 | Exceptional 91.0% |
| Zimbabweans | 97.7 /100 | #106 | Exceptional 91.0% |
| Maltese | 97.7 /100 | #107 | Exceptional 91.0% |
| Hispanics or Latinos | 97.6 /100 | #108 | Exceptional 91.0% |
| Delaware | 97.6 /100 | #109 | Exceptional 91.0% |
| Mexican American Indians | 97.4 /100 | #110 | Exceptional 91.0% |
| Navajo | 95.8 /100 | #111 | Exceptional 90.8% |
| Immigrants | Netherlands | 95.7 /100 | #112 | Exceptional 90.8% |
| Immigrants | Kuwait | 94.7 /100 | #113 | Exceptional 90.7% |
| Armenians | 94.5 /100 | #114 | Exceptional 90.7% |
| Serbians | 94.3 /100 | #115 | Exceptional 90.7% |
| Chippewa | 94.3 /100 | #116 | Exceptional 90.7% |
| Greeks | 93.5 /100 | #117 | Exceptional 90.6% |
| Japanese | 93.4 /100 | #118 | Exceptional 90.6% |
| Blackfeet | 92.6 /100 | #119 | Exceptional 90.6% |
Demographics Similar to Bangladeshis by 1 or more Vehicles in Household
In terms of 1 or more vehicles in household, the demographic groups most similar to Bangladeshis are Spanish American (91.4%, a difference of 0.0%), Immigrants from Canada (91.4%, a difference of 0.0%), Immigrants from Jordan (91.4%, a difference of 0.0%), Osage (91.4%, a difference of 0.010%), and Immigrants from Germany (91.4%, a difference of 0.010%).
| Demographics | Rating | Rank | 1 or more Vehicles in Household |
| Lebanese | 99.3 /100 | #82 | Exceptional 91.4% |
| Immigrants | England | 99.3 /100 | #83 | Exceptional 91.4% |
| Jordanians | 99.3 /100 | #84 | Exceptional 91.4% |
| Tsimshian | 99.3 /100 | #85 | Exceptional 91.4% |
| Osage | 99.2 /100 | #86 | Exceptional 91.4% |
| Immigrants | Germany | 99.2 /100 | #87 | Exceptional 91.4% |
| Spanish Americans | 99.2 /100 | #88 | Exceptional 91.4% |
| Bangladeshis | 99.2 /100 | #89 | Exceptional 91.4% |
| Immigrants | Canada | 99.2 /100 | #90 | Exceptional 91.4% |
| Immigrants | Jordan | 99.2 /100 | #91 | Exceptional 91.4% |
| Bhutanese | 99.2 /100 | #92 | Exceptional 91.4% |
| Immigrants | North America | 99.2 /100 | #93 | Exceptional 91.4% |
| Immigrants | Cuba | 99.1 /100 | #94 | Exceptional 91.3% |
| Austrians | 99.0 /100 | #95 | Exceptional 91.3% |
| Potawatomi | 99.0 /100 | #96 | Exceptional 91.3% |