Immigrants from Netherlands vs French American Indian 1 or more Vehicles in Household
COMPARE
Immigrants from Netherlands
French American Indian
1 or more Vehicles in Household
1 or more Vehicles in Household Comparison
Immigrants from Netherlands
French American Indians
90.8%
1 OR MORE VEHICLES IN HOUSEHOLD
95.7/ 100
METRIC RATING
112th/ 347
METRIC RANK
89.8%
1 OR MORE VEHICLES IN HOUSEHOLD
54.4/ 100
METRIC RATING
171st/ 347
METRIC RANK
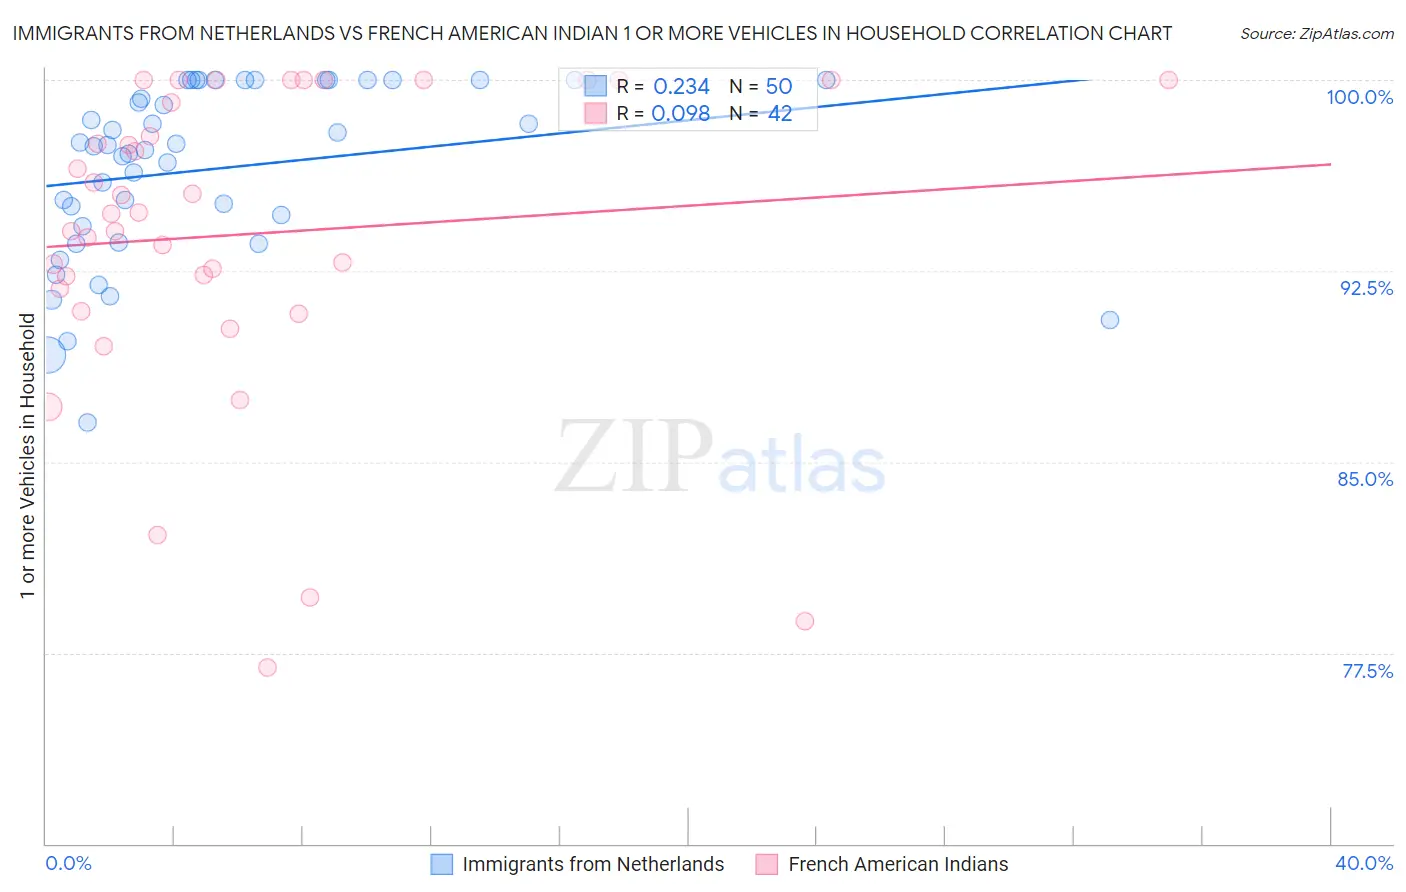
Immigrants from Netherlands vs French American Indian 1 or more Vehicles in Household Correlation Chart
The statistical analysis conducted on geographies consisting of 237,818,217 people shows a weak positive correlation between the proportion of Immigrants from Netherlands and percentage of households with 1 or more vehicles available in the United States with a correlation coefficient (R) of 0.234 and weighted average of 90.8%. Similarly, the statistical analysis conducted on geographies consisting of 131,972,990 people shows a slight positive correlation between the proportion of French American Indians and percentage of households with 1 or more vehicles available in the United States with a correlation coefficient (R) of 0.098 and weighted average of 89.8%, a difference of 1.1%.
1 or more Vehicles in Household Correlation Summary
| Measurement | Immigrants from Netherlands | French American Indian |
| Minimum | 86.5% | 76.9% |
| Maximum | 100.0% | 100.0% |
| Range | 13.5% | 23.1% |
| Mean | 96.5% | 93.9% |
| Median | 97.4% | 94.8% |
| Interquartile 25% (IQ1) | 94.2% | 91.8% |
| Interquartile 75% (IQ3) | 100.0% | 100.0% |
| Interquartile Range (IQR) | 5.8% | 8.2% |
| Standard Deviation (Sample) | 3.5% | 6.1% |
| Standard Deviation (Population) | 3.4% | 6.0% |
Similar Demographics by 1 or more Vehicles in Household
Demographics Similar to Immigrants from Netherlands by 1 or more Vehicles in Household
In terms of 1 or more vehicles in household, the demographic groups most similar to Immigrants from Netherlands are Navajo (90.8%, a difference of 0.010%), Immigrants from Kuwait (90.7%, a difference of 0.080%), Armenian (90.7%, a difference of 0.10%), Serbian (90.7%, a difference of 0.11%), and Chippewa (90.7%, a difference of 0.11%).
| Demographics | Rating | Rank | 1 or more Vehicles in Household |
| Laotians | 98.0 /100 | #105 | Exceptional 91.0% |
| Zimbabweans | 97.7 /100 | #106 | Exceptional 91.0% |
| Maltese | 97.7 /100 | #107 | Exceptional 91.0% |
| Hispanics or Latinos | 97.6 /100 | #108 | Exceptional 91.0% |
| Delaware | 97.6 /100 | #109 | Exceptional 91.0% |
| Mexican American Indians | 97.4 /100 | #110 | Exceptional 91.0% |
| Navajo | 95.8 /100 | #111 | Exceptional 90.8% |
| Immigrants | Netherlands | 95.7 /100 | #112 | Exceptional 90.8% |
| Immigrants | Kuwait | 94.7 /100 | #113 | Exceptional 90.7% |
| Armenians | 94.5 /100 | #114 | Exceptional 90.7% |
| Serbians | 94.3 /100 | #115 | Exceptional 90.7% |
| Chippewa | 94.3 /100 | #116 | Exceptional 90.7% |
| Greeks | 93.5 /100 | #117 | Exceptional 90.6% |
| Japanese | 93.4 /100 | #118 | Exceptional 90.6% |
| Blackfeet | 92.6 /100 | #119 | Exceptional 90.6% |
Demographics Similar to French American Indians by 1 or more Vehicles in Household
In terms of 1 or more vehicles in household, the demographic groups most similar to French American Indians are Indonesian (89.7%, a difference of 0.020%), Lumbee (89.7%, a difference of 0.020%), Immigrants from Costa Rica (89.8%, a difference of 0.050%), Filipino (89.7%, a difference of 0.070%), and Native/Alaskan (89.8%, a difference of 0.080%).
| Demographics | Rating | Rank | 1 or more Vehicles in Household |
| Comanche | 63.4 /100 | #164 | Good 89.9% |
| Immigrants | Saudi Arabia | 62.6 /100 | #165 | Good 89.9% |
| Immigrants | Middle Africa | 62.2 /100 | #166 | Good 89.9% |
| Immigrants | Latin America | 60.3 /100 | #167 | Good 89.8% |
| Immigrants | Cambodia | 60.1 /100 | #168 | Good 89.8% |
| Natives/Alaskans | 59.5 /100 | #169 | Average 89.8% |
| Immigrants | Costa Rica | 57.6 /100 | #170 | Average 89.8% |
| French American Indians | 54.4 /100 | #171 | Average 89.8% |
| Indonesians | 53.0 /100 | #172 | Average 89.7% |
| Lumbee | 52.8 /100 | #173 | Average 89.7% |
| Filipinos | 50.0 /100 | #174 | Average 89.7% |
| Immigrants | Burma/Myanmar | 47.6 /100 | #175 | Average 89.7% |
| Immigrants | Sudan | 47.1 /100 | #176 | Average 89.7% |
| Hmong | 45.8 /100 | #177 | Average 89.6% |
| Immigrants | El Salvador | 44.1 /100 | #178 | Average 89.6% |