Immigrants from Netherlands vs Immigrants from Belgium 1 or more Vehicles in Household
COMPARE
Immigrants from Netherlands
Immigrants from Belgium
1 or more Vehicles in Household
1 or more Vehicles in Household Comparison
Immigrants from Netherlands
Immigrants from Belgium
90.8%
1 OR MORE VEHICLES IN HOUSEHOLD
95.7/ 100
METRIC RATING
112th/ 347
METRIC RANK
88.4%
1 OR MORE VEHICLES IN HOUSEHOLD
2.1/ 100
METRIC RATING
243rd/ 347
METRIC RANK
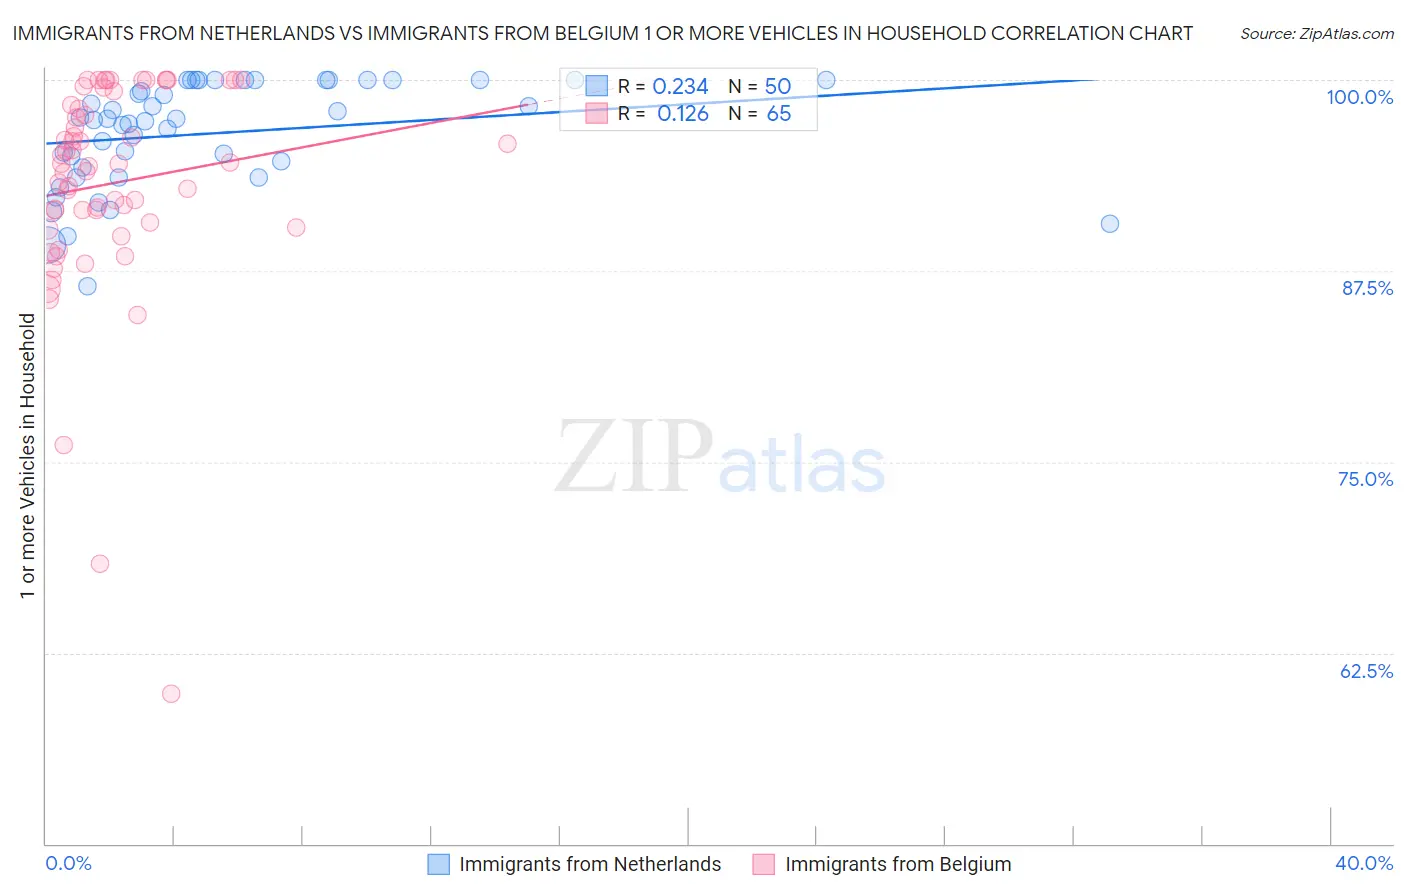
Immigrants from Netherlands vs Immigrants from Belgium 1 or more Vehicles in Household Correlation Chart
The statistical analysis conducted on geographies consisting of 237,818,217 people shows a weak positive correlation between the proportion of Immigrants from Netherlands and percentage of households with 1 or more vehicles available in the United States with a correlation coefficient (R) of 0.234 and weighted average of 90.8%. Similarly, the statistical analysis conducted on geographies consisting of 146,691,899 people shows a poor positive correlation between the proportion of Immigrants from Belgium and percentage of households with 1 or more vehicles available in the United States with a correlation coefficient (R) of 0.126 and weighted average of 88.4%, a difference of 2.7%.
1 or more Vehicles in Household Correlation Summary
| Measurement | Immigrants from Netherlands | Immigrants from Belgium |
| Minimum | 86.5% | 59.8% |
| Maximum | 100.0% | 100.0% |
| Range | 13.5% | 40.2% |
| Mean | 96.5% | 93.2% |
| Median | 97.4% | 94.5% |
| Interquartile 25% (IQ1) | 94.2% | 90.5% |
| Interquartile 75% (IQ3) | 100.0% | 98.8% |
| Interquartile Range (IQR) | 5.8% | 8.4% |
| Standard Deviation (Sample) | 3.5% | 7.2% |
| Standard Deviation (Population) | 3.4% | 7.2% |
Similar Demographics by 1 or more Vehicles in Household
Demographics Similar to Immigrants from Netherlands by 1 or more Vehicles in Household
In terms of 1 or more vehicles in household, the demographic groups most similar to Immigrants from Netherlands are Navajo (90.8%, a difference of 0.010%), Immigrants from Kuwait (90.7%, a difference of 0.080%), Armenian (90.7%, a difference of 0.10%), Serbian (90.7%, a difference of 0.11%), and Chippewa (90.7%, a difference of 0.11%).
| Demographics | Rating | Rank | 1 or more Vehicles in Household |
| Laotians | 98.0 /100 | #105 | Exceptional 91.0% |
| Zimbabweans | 97.7 /100 | #106 | Exceptional 91.0% |
| Maltese | 97.7 /100 | #107 | Exceptional 91.0% |
| Hispanics or Latinos | 97.6 /100 | #108 | Exceptional 91.0% |
| Delaware | 97.6 /100 | #109 | Exceptional 91.0% |
| Mexican American Indians | 97.4 /100 | #110 | Exceptional 91.0% |
| Navajo | 95.8 /100 | #111 | Exceptional 90.8% |
| Immigrants | Netherlands | 95.7 /100 | #112 | Exceptional 90.8% |
| Immigrants | Kuwait | 94.7 /100 | #113 | Exceptional 90.7% |
| Armenians | 94.5 /100 | #114 | Exceptional 90.7% |
| Serbians | 94.3 /100 | #115 | Exceptional 90.7% |
| Chippewa | 94.3 /100 | #116 | Exceptional 90.7% |
| Greeks | 93.5 /100 | #117 | Exceptional 90.6% |
| Japanese | 93.4 /100 | #118 | Exceptional 90.6% |
| Blackfeet | 92.6 /100 | #119 | Exceptional 90.6% |
Demographics Similar to Immigrants from Belgium by 1 or more Vehicles in Household
In terms of 1 or more vehicles in household, the demographic groups most similar to Immigrants from Belgium are Immigrants from Portugal (88.3%, a difference of 0.020%), Immigrants from Czechoslovakia (88.3%, a difference of 0.040%), Menominee (88.3%, a difference of 0.050%), Turkish (88.4%, a difference of 0.060%), and Immigrants from Honduras (88.3%, a difference of 0.080%).
| Demographics | Rating | Rank | 1 or more Vehicles in Household |
| Immigrants | Pakistan | 4.5 /100 | #236 | Tragic 88.6% |
| Immigrants | Turkey | 4.4 /100 | #237 | Tragic 88.6% |
| Immigrants | Somalia | 4.2 /100 | #238 | Tragic 88.6% |
| Kiowa | 3.8 /100 | #239 | Tragic 88.6% |
| Eastern Europeans | 3.0 /100 | #240 | Tragic 88.5% |
| Taiwanese | 2.6 /100 | #241 | Tragic 88.4% |
| Turks | 2.5 /100 | #242 | Tragic 88.4% |
| Immigrants | Belgium | 2.1 /100 | #243 | Tragic 88.4% |
| Immigrants | Portugal | 2.0 /100 | #244 | Tragic 88.3% |
| Immigrants | Czechoslovakia | 1.9 /100 | #245 | Tragic 88.3% |
| Menominee | 1.9 /100 | #246 | Tragic 88.3% |
| Immigrants | Honduras | 1.7 /100 | #247 | Tragic 88.3% |
| Immigrants | Nigeria | 1.5 /100 | #248 | Tragic 88.2% |
| Blacks/African Americans | 1.4 /100 | #249 | Tragic 88.2% |
| Egyptians | 1.2 /100 | #250 | Tragic 88.2% |