Immigrants from Moldova vs Bulgarian Ambulatory Disability
COMPARE
Immigrants from Moldova
Bulgarian
Ambulatory Disability
Ambulatory Disability Comparison
Immigrants from Moldova
Bulgarians
6.0%
AMBULATORY DISABILITY
82.4/ 100
METRIC RATING
147th/ 347
METRIC RANK
5.6%
AMBULATORY DISABILITY
99.9/ 100
METRIC RATING
49th/ 347
METRIC RANK
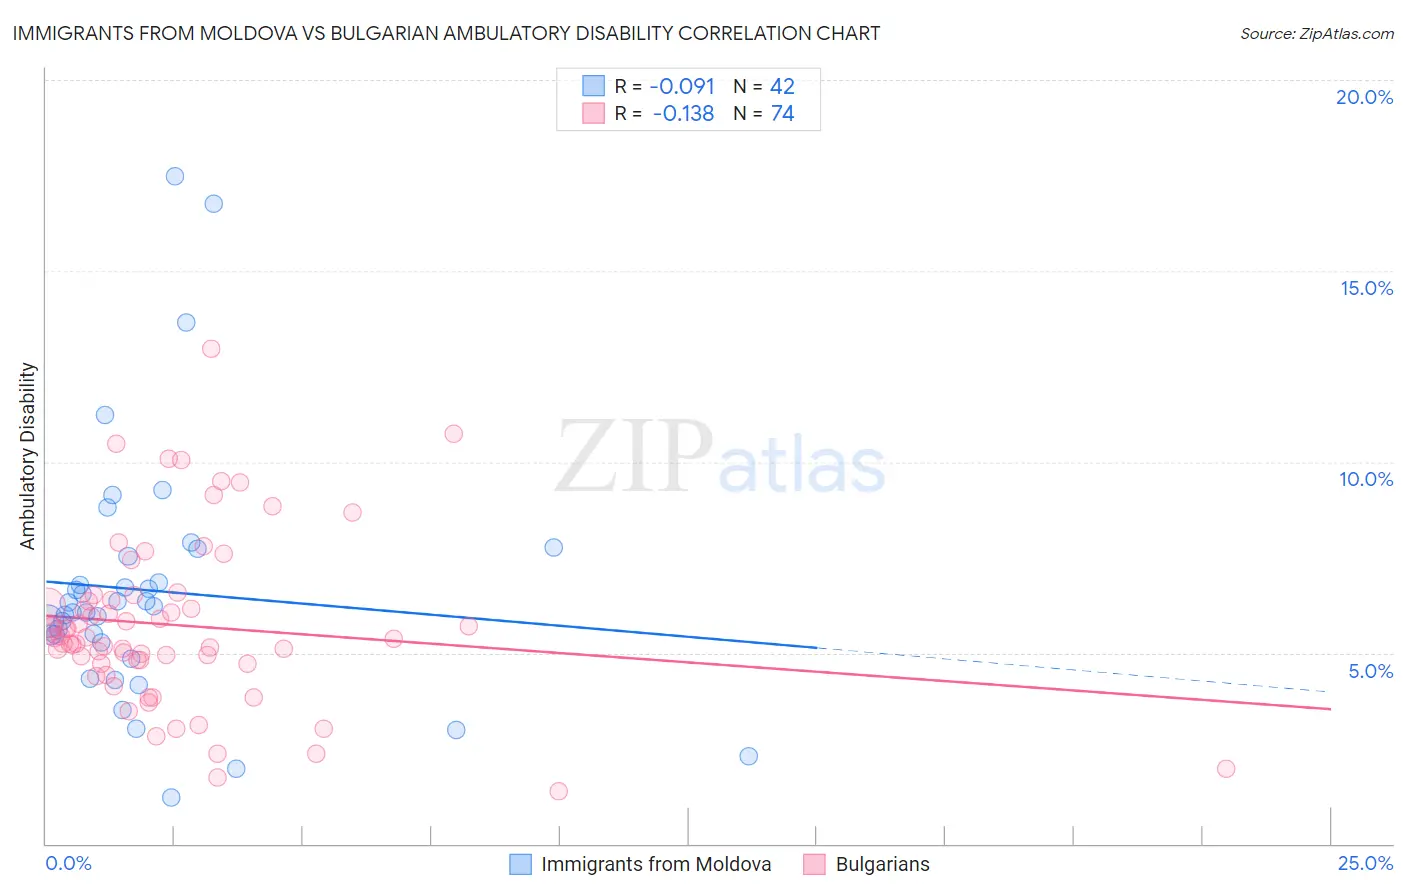
Immigrants from Moldova vs Bulgarian Ambulatory Disability Correlation Chart
The statistical analysis conducted on geographies consisting of 124,381,325 people shows a slight negative correlation between the proportion of Immigrants from Moldova and percentage of population with ambulatory disability in the United States with a correlation coefficient (R) of -0.091 and weighted average of 6.0%. Similarly, the statistical analysis conducted on geographies consisting of 205,613,194 people shows a poor negative correlation between the proportion of Bulgarians and percentage of population with ambulatory disability in the United States with a correlation coefficient (R) of -0.138 and weighted average of 5.6%, a difference of 7.6%.
Ambulatory Disability Correlation Summary
| Measurement | Immigrants from Moldova | Bulgarian |
| Minimum | 1.2% | 1.4% |
| Maximum | 17.5% | 12.9% |
| Range | 16.3% | 11.6% |
| Mean | 6.6% | 5.7% |
| Median | 6.1% | 5.4% |
| Interquartile 25% (IQ1) | 5.3% | 4.7% |
| Interquartile 75% (IQ3) | 7.5% | 6.4% |
| Interquartile Range (IQR) | 2.2% | 1.6% |
| Standard Deviation (Sample) | 3.3% | 2.2% |
| Standard Deviation (Population) | 3.3% | 2.2% |
Similar Demographics by Ambulatory Disability
Demographics Similar to Immigrants from Moldova by Ambulatory Disability
In terms of ambulatory disability, the demographic groups most similar to Immigrants from Moldova are Pakistani (6.0%, a difference of 0.010%), Immigrants from Greece (6.0%, a difference of 0.010%), Macedonian (6.0%, a difference of 0.040%), Immigrants from Eastern Europe (6.0%, a difference of 0.040%), and Romanian (6.0%, a difference of 0.050%).
| Demographics | Rating | Rank | Ambulatory Disability |
| Czechs | 83.3 /100 | #140 | Excellent 6.0% |
| Swedes | 83.1 /100 | #141 | Excellent 6.0% |
| Immigrants | Philippines | 83.0 /100 | #142 | Excellent 6.0% |
| Romanians | 82.9 /100 | #143 | Excellent 6.0% |
| Macedonians | 82.8 /100 | #144 | Excellent 6.0% |
| Pakistanis | 82.5 /100 | #145 | Excellent 6.0% |
| Immigrants | Greece | 82.5 /100 | #146 | Excellent 6.0% |
| Immigrants | Moldova | 82.4 /100 | #147 | Excellent 6.0% |
| Immigrants | Eastern Europe | 82.0 /100 | #148 | Excellent 6.0% |
| Lithuanians | 81.9 /100 | #149 | Excellent 6.0% |
| Maltese | 81.6 /100 | #150 | Excellent 6.0% |
| Greeks | 79.6 /100 | #151 | Good 6.0% |
| Immigrants | Austria | 78.8 /100 | #152 | Good 6.0% |
| Syrians | 75.5 /100 | #153 | Good 6.0% |
| Immigrants | Croatia | 75.1 /100 | #154 | Good 6.0% |
Demographics Similar to Bulgarians by Ambulatory Disability
In terms of ambulatory disability, the demographic groups most similar to Bulgarians are Immigrants from Argentina (5.6%, a difference of 0.19%), Egyptian (5.6%, a difference of 0.21%), Immigrants from Japan (5.6%, a difference of 0.21%), Immigrants from Sweden (5.6%, a difference of 0.22%), and Luxembourger (5.6%, a difference of 0.34%).
| Demographics | Rating | Rank | Ambulatory Disability |
| Argentineans | 99.9 /100 | #42 | Exceptional 5.5% |
| Paraguayans | 99.9 /100 | #43 | Exceptional 5.5% |
| Immigrants | Indonesia | 99.9 /100 | #44 | Exceptional 5.5% |
| Immigrants | Sweden | 99.9 /100 | #45 | Exceptional 5.6% |
| Egyptians | 99.9 /100 | #46 | Exceptional 5.6% |
| Immigrants | Japan | 99.9 /100 | #47 | Exceptional 5.6% |
| Immigrants | Argentina | 99.9 /100 | #48 | Exceptional 5.6% |
| Bulgarians | 99.9 /100 | #49 | Exceptional 5.6% |
| Luxembourgers | 99.9 /100 | #50 | Exceptional 5.6% |
| Taiwanese | 99.8 /100 | #51 | Exceptional 5.6% |
| Jordanians | 99.8 /100 | #52 | Exceptional 5.6% |
| Immigrants | Egypt | 99.8 /100 | #53 | Exceptional 5.6% |
| Immigrants | Eastern Africa | 99.8 /100 | #54 | Exceptional 5.6% |
| Immigrants | Bulgaria | 99.8 /100 | #55 | Exceptional 5.6% |
| Inupiat | 99.8 /100 | #56 | Exceptional 5.6% |