Immigrants from Moldova vs Bulgarian Child Poverty Among Girls Under 16
COMPARE
Immigrants from Moldova
Bulgarian
Child Poverty Among Girls Under 16
Child Poverty Among Girls Under 16 Comparison
Immigrants from Moldova
Bulgarians
13.9%
CHILD POVERTY AMONG GIRLS UNDER 16
99.6/ 100
METRIC RATING
38th/ 347
METRIC RANK
13.1%
CHILD POVERTY AMONG GIRLS UNDER 16
99.9/ 100
METRIC RATING
17th/ 347
METRIC RANK
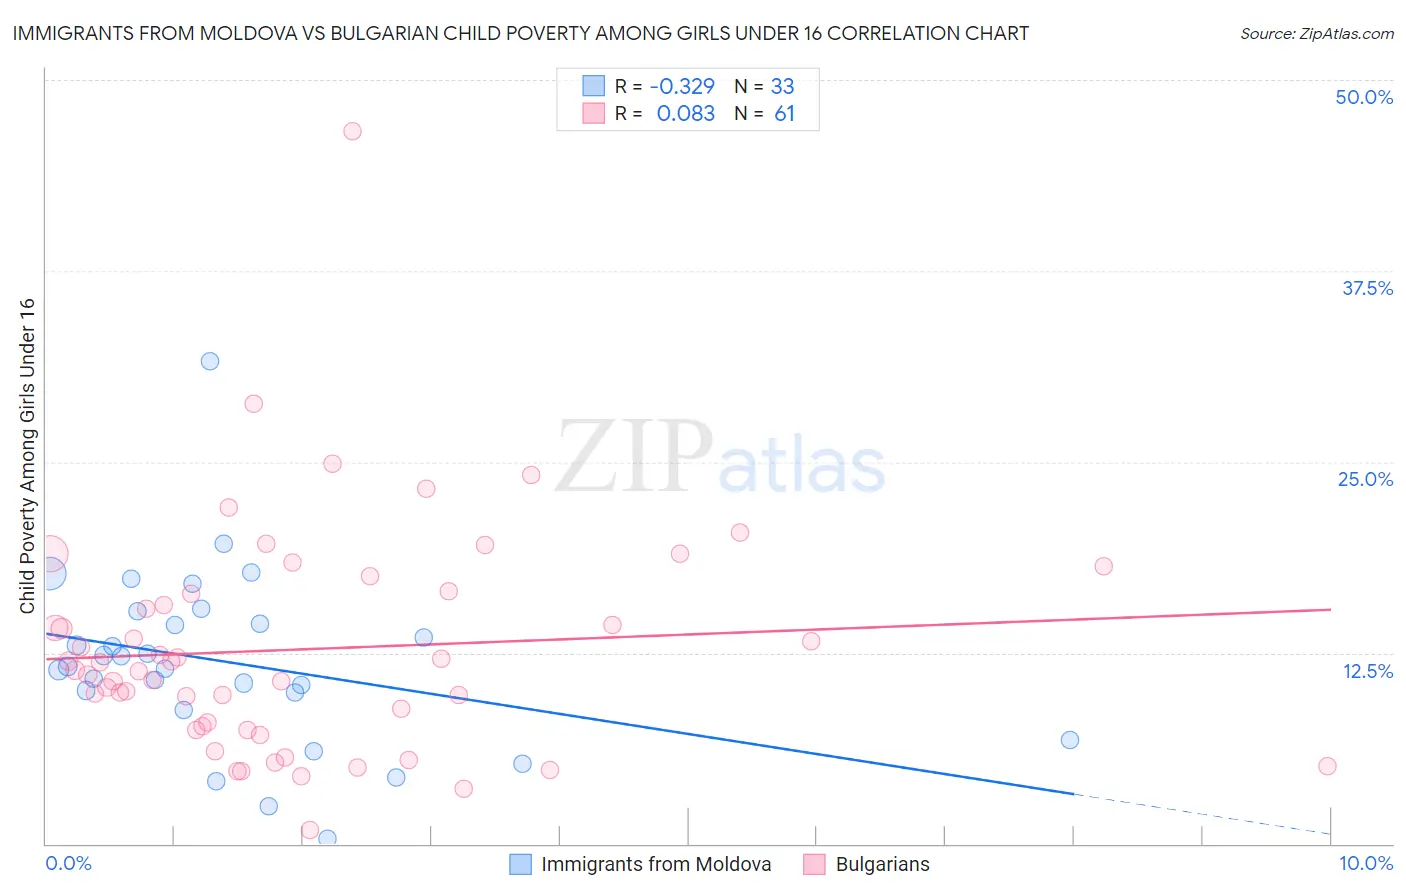
Immigrants from Moldova vs Bulgarian Child Poverty Among Girls Under 16 Correlation Chart
The statistical analysis conducted on geographies consisting of 123,298,650 people shows a mild negative correlation between the proportion of Immigrants from Moldova and poverty level among girls under the age of 16 in the United States with a correlation coefficient (R) of -0.329 and weighted average of 13.9%. Similarly, the statistical analysis conducted on geographies consisting of 202,945,490 people shows a slight positive correlation between the proportion of Bulgarians and poverty level among girls under the age of 16 in the United States with a correlation coefficient (R) of 0.083 and weighted average of 13.1%, a difference of 5.8%.
Child Poverty Among Girls Under 16 Correlation Summary
| Measurement | Immigrants from Moldova | Bulgarian |
| Minimum | 0.37% | 0.87% |
| Maximum | 31.6% | 46.7% |
| Range | 31.2% | 45.8% |
| Mean | 11.9% | 12.7% |
| Median | 11.6% | 11.4% |
| Interquartile 25% (IQ1) | 9.3% | 7.6% |
| Interquartile 75% (IQ3) | 14.8% | 16.4% |
| Interquartile Range (IQR) | 5.5% | 8.9% |
| Standard Deviation (Sample) | 5.8% | 7.4% |
| Standard Deviation (Population) | 5.7% | 7.3% |
Similar Demographics by Child Poverty Among Girls Under 16
Demographics Similar to Immigrants from Moldova by Child Poverty Among Girls Under 16
In terms of child poverty among girls under 16, the demographic groups most similar to Immigrants from Moldova are Lithuanian (13.9%, a difference of 0.30%), Russian (13.9%, a difference of 0.32%), Immigrants from Northern Europe (13.8%, a difference of 0.47%), Immigrants from Australia (14.0%, a difference of 0.65%), and Immigrants from Sri Lanka (14.0%, a difference of 0.74%).
| Demographics | Rating | Rank | Child Poverty Among Girls Under 16 |
| Turks | 99.7 /100 | #31 | Exceptional 13.7% |
| Danes | 99.7 /100 | #32 | Exceptional 13.7% |
| Swedes | 99.7 /100 | #33 | Exceptional 13.7% |
| Maltese | 99.7 /100 | #34 | Exceptional 13.7% |
| Immigrants | Northern Europe | 99.6 /100 | #35 | Exceptional 13.8% |
| Russians | 99.6 /100 | #36 | Exceptional 13.9% |
| Lithuanians | 99.6 /100 | #37 | Exceptional 13.9% |
| Immigrants | Moldova | 99.6 /100 | #38 | Exceptional 13.9% |
| Immigrants | Australia | 99.5 /100 | #39 | Exceptional 14.0% |
| Immigrants | Sri Lanka | 99.5 /100 | #40 | Exceptional 14.0% |
| Immigrants | Bolivia | 99.5 /100 | #41 | Exceptional 14.0% |
| Immigrants | Scotland | 99.4 /100 | #42 | Exceptional 14.0% |
| Koreans | 99.4 /100 | #43 | Exceptional 14.1% |
| Immigrants | Asia | 99.4 /100 | #44 | Exceptional 14.1% |
| Immigrants | Greece | 99.3 /100 | #45 | Exceptional 14.1% |
Demographics Similar to Bulgarians by Child Poverty Among Girls Under 16
In terms of child poverty among girls under 16, the demographic groups most similar to Bulgarians are Immigrants from Korea (13.1%, a difference of 0.020%), Immigrants from Lithuania (13.1%, a difference of 0.080%), Cypriot (13.2%, a difference of 0.39%), Okinawan (13.0%, a difference of 1.0%), and Burmese (13.0%, a difference of 1.0%).
| Demographics | Rating | Rank | Child Poverty Among Girls Under 16 |
| Immigrants | Iran | 100.0 /100 | #10 | Exceptional 12.6% |
| Immigrants | South Central Asia | 100.0 /100 | #11 | Exceptional 12.7% |
| Bhutanese | 100.0 /100 | #12 | Exceptional 12.7% |
| Immigrants | Ireland | 99.9 /100 | #13 | Exceptional 12.9% |
| Burmese | 99.9 /100 | #14 | Exceptional 13.0% |
| Okinawans | 99.9 /100 | #15 | Exceptional 13.0% |
| Immigrants | Lithuania | 99.9 /100 | #16 | Exceptional 13.1% |
| Bulgarians | 99.9 /100 | #17 | Exceptional 13.1% |
| Immigrants | Korea | 99.9 /100 | #18 | Exceptional 13.1% |
| Cypriots | 99.9 /100 | #19 | Exceptional 13.2% |
| Immigrants | Japan | 99.9 /100 | #20 | Exceptional 13.3% |
| Assyrians/Chaldeans/Syriacs | 99.9 /100 | #21 | Exceptional 13.3% |
| Indians (Asian) | 99.9 /100 | #22 | Exceptional 13.3% |
| Norwegians | 99.9 /100 | #23 | Exceptional 13.3% |
| Immigrants | Eastern Asia | 99.9 /100 | #24 | Exceptional 13.4% |