Immigrants from Honduras vs Bulgarian 1 or more Vehicles in Household
COMPARE
Immigrants from Honduras
Bulgarian
1 or more Vehicles in Household
1 or more Vehicles in Household Comparison
Immigrants from Honduras
Bulgarians
88.3%
1 OR MORE VEHICLES IN HOUSEHOLD
1.7/ 100
METRIC RATING
247th/ 347
METRIC RANK
91.1%
1 OR MORE VEHICLES IN HOUSEHOLD
98.4/ 100
METRIC RATING
101st/ 347
METRIC RANK
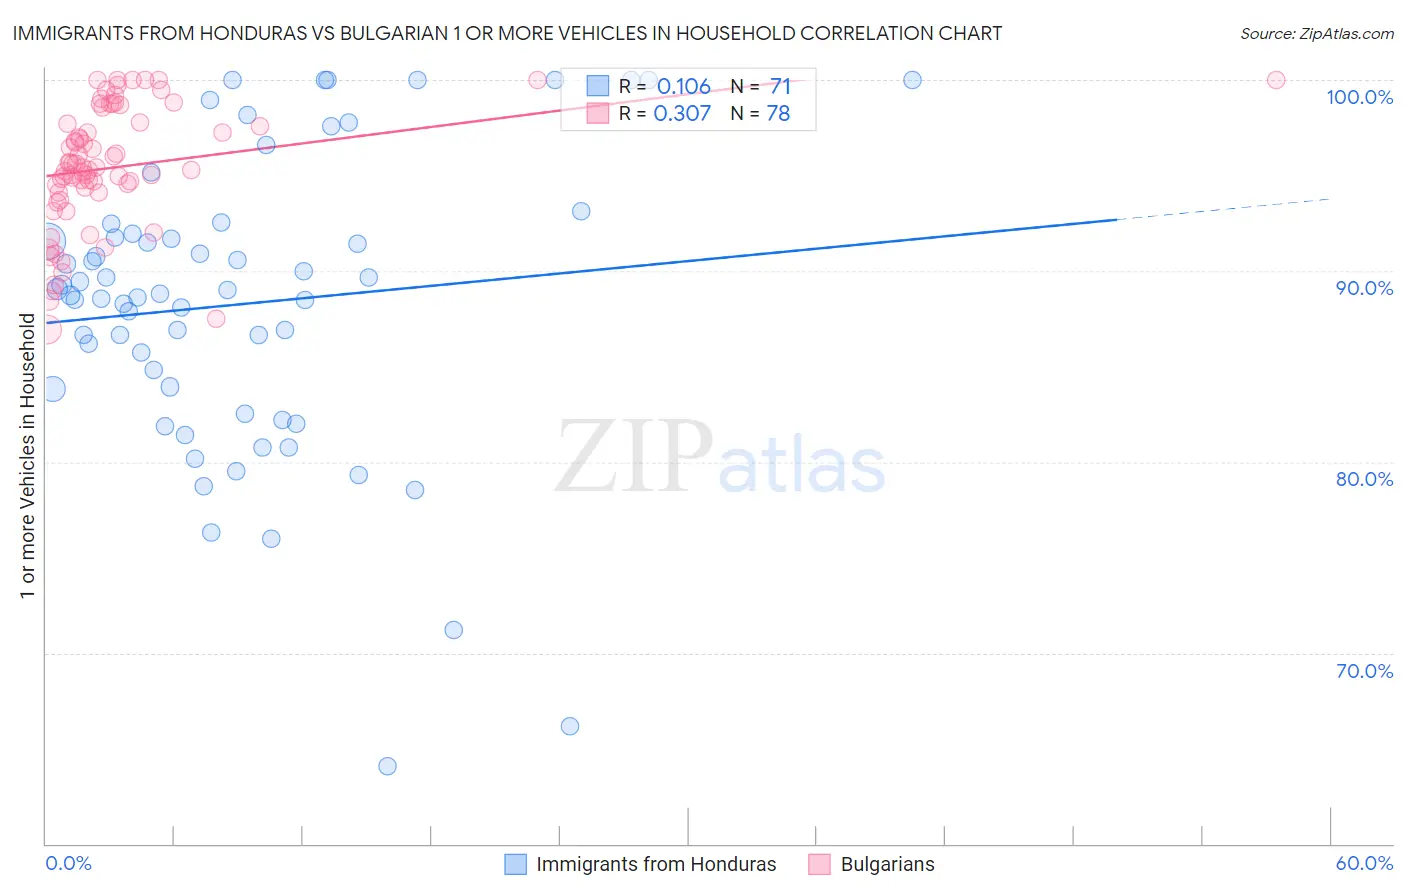
Immigrants from Honduras vs Bulgarian 1 or more Vehicles in Household Correlation Chart
The statistical analysis conducted on geographies consisting of 322,472,678 people shows a poor positive correlation between the proportion of Immigrants from Honduras and percentage of households with 1 or more vehicles available in the United States with a correlation coefficient (R) of 0.106 and weighted average of 88.3%. Similarly, the statistical analysis conducted on geographies consisting of 205,574,204 people shows a mild positive correlation between the proportion of Bulgarians and percentage of households with 1 or more vehicles available in the United States with a correlation coefficient (R) of 0.307 and weighted average of 91.1%, a difference of 3.2%.
1 or more Vehicles in Household Correlation Summary
| Measurement | Immigrants from Honduras | Bulgarian |
| Minimum | 64.1% | 86.9% |
| Maximum | 100.0% | 100.0% |
| Range | 35.9% | 13.1% |
| Mean | 88.3% | 95.5% |
| Median | 88.8% | 95.4% |
| Interquartile 25% (IQ1) | 83.8% | 94.1% |
| Interquartile 75% (IQ3) | 92.0% | 97.8% |
| Interquartile Range (IQR) | 8.2% | 3.7% |
| Standard Deviation (Sample) | 7.8% | 3.2% |
| Standard Deviation (Population) | 7.7% | 3.2% |
Similar Demographics by 1 or more Vehicles in Household
Demographics Similar to Immigrants from Honduras by 1 or more Vehicles in Household
In terms of 1 or more vehicles in household, the demographic groups most similar to Immigrants from Honduras are Menominee (88.3%, a difference of 0.040%), Immigrants from Czechoslovakia (88.3%, a difference of 0.050%), Immigrants from Nigeria (88.2%, a difference of 0.050%), Immigrants from Portugal (88.3%, a difference of 0.060%), and Immigrants from Belgium (88.4%, a difference of 0.080%).
| Demographics | Rating | Rank | 1 or more Vehicles in Household |
| Eastern Europeans | 3.0 /100 | #240 | Tragic 88.5% |
| Taiwanese | 2.6 /100 | #241 | Tragic 88.4% |
| Turks | 2.5 /100 | #242 | Tragic 88.4% |
| Immigrants | Belgium | 2.1 /100 | #243 | Tragic 88.4% |
| Immigrants | Portugal | 2.0 /100 | #244 | Tragic 88.3% |
| Immigrants | Czechoslovakia | 1.9 /100 | #245 | Tragic 88.3% |
| Menominee | 1.9 /100 | #246 | Tragic 88.3% |
| Immigrants | Honduras | 1.7 /100 | #247 | Tragic 88.3% |
| Immigrants | Nigeria | 1.5 /100 | #248 | Tragic 88.2% |
| Blacks/African Americans | 1.4 /100 | #249 | Tragic 88.2% |
| Egyptians | 1.2 /100 | #250 | Tragic 88.2% |
| Immigrants | Serbia | 1.2 /100 | #251 | Tragic 88.2% |
| Immigrants | Uruguay | 1.1 /100 | #252 | Tragic 88.1% |
| Hondurans | 1.0 /100 | #253 | Tragic 88.1% |
| Haitians | 0.9 /100 | #254 | Tragic 88.1% |
Demographics Similar to Bulgarians by 1 or more Vehicles in Household
In terms of 1 or more vehicles in household, the demographic groups most similar to Bulgarians are Immigrants from Central America (91.1%, a difference of 0.010%), Seminole (91.1%, a difference of 0.020%), Yugoslavian (91.1%, a difference of 0.030%), Asian (91.1%, a difference of 0.040%), and Immigrants from Bolivia (91.2%, a difference of 0.050%).
| Demographics | Rating | Rank | 1 or more Vehicles in Household |
| Immigrants | Cuba | 99.1 /100 | #94 | Exceptional 91.3% |
| Austrians | 99.0 /100 | #95 | Exceptional 91.3% |
| Potawatomi | 99.0 /100 | #96 | Exceptional 91.3% |
| Pakistanis | 99.0 /100 | #97 | Exceptional 91.3% |
| Slavs | 98.7 /100 | #98 | Exceptional 91.2% |
| Immigrants | Bolivia | 98.6 /100 | #99 | Exceptional 91.2% |
| Immigrants | Central America | 98.4 /100 | #100 | Exceptional 91.1% |
| Bulgarians | 98.4 /100 | #101 | Exceptional 91.1% |
| Seminole | 98.3 /100 | #102 | Exceptional 91.1% |
| Yugoslavians | 98.3 /100 | #103 | Exceptional 91.1% |
| Asians | 98.2 /100 | #104 | Exceptional 91.1% |
| Laotians | 98.0 /100 | #105 | Exceptional 91.0% |
| Zimbabweans | 97.7 /100 | #106 | Exceptional 91.0% |
| Maltese | 97.7 /100 | #107 | Exceptional 91.0% |
| Hispanics or Latinos | 97.6 /100 | #108 | Exceptional 91.0% |