Immigrants from Lithuania vs Mexican American Indian 4 or more Vehicles in Household
COMPARE
Immigrants from Lithuania
Mexican American Indian
4 or more Vehicles in Household
4 or more Vehicles in Household Comparison
Immigrants from Lithuania
Mexican American Indians
5.6%
4 OR MORE VEHICLES IN HOUSEHOLD
1.4/ 100
METRIC RATING
258th/ 347
METRIC RANK
8.4%
4 OR MORE VEHICLES IN HOUSEHOLD
100.0/ 100
METRIC RATING
26th/ 347
METRIC RANK
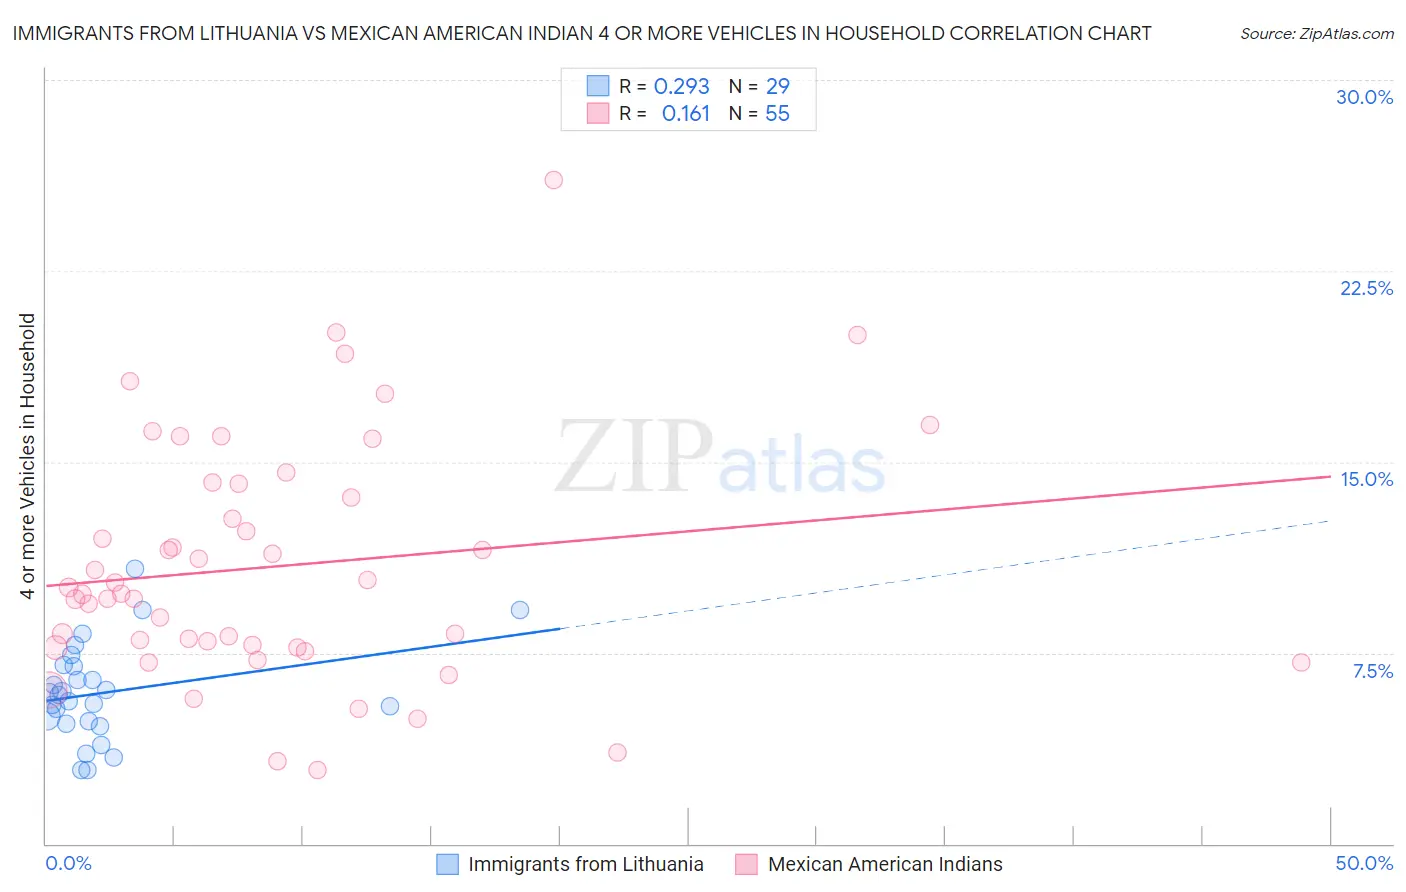
Immigrants from Lithuania vs Mexican American Indian 4 or more Vehicles in Household Correlation Chart
The statistical analysis conducted on geographies consisting of 117,416,675 people shows a weak positive correlation between the proportion of Immigrants from Lithuania and percentage of households with 4 or more vehicles available in the United States with a correlation coefficient (R) of 0.293 and weighted average of 5.6%. Similarly, the statistical analysis conducted on geographies consisting of 316,602,557 people shows a poor positive correlation between the proportion of Mexican American Indians and percentage of households with 4 or more vehicles available in the United States with a correlation coefficient (R) of 0.161 and weighted average of 8.4%, a difference of 49.1%.
4 or more Vehicles in Household Correlation Summary
| Measurement | Immigrants from Lithuania | Mexican American Indian |
| Minimum | 2.9% | 2.9% |
| Maximum | 10.8% | 26.1% |
| Range | 7.9% | 23.2% |
| Mean | 6.0% | 10.9% |
| Median | 5.8% | 9.8% |
| Interquartile 25% (IQ1) | 4.8% | 7.7% |
| Interquartile 75% (IQ3) | 7.0% | 14.1% |
| Interquartile Range (IQR) | 2.2% | 6.4% |
| Standard Deviation (Sample) | 1.9% | 4.7% |
| Standard Deviation (Population) | 1.9% | 4.7% |
Similar Demographics by 4 or more Vehicles in Household
Demographics Similar to Immigrants from Lithuania by 4 or more Vehicles in Household
In terms of 4 or more vehicles in household, the demographic groups most similar to Immigrants from Lithuania are Immigrants from France (5.6%, a difference of 0.030%), Immigrants from Northern Africa (5.6%, a difference of 0.14%), Immigrants from Turkey (5.7%, a difference of 0.22%), Uruguayan (5.6%, a difference of 0.22%), and Yup'ik (5.7%, a difference of 0.25%).
| Demographics | Rating | Rank | 4 or more Vehicles in Household |
| Ugandans | 2.2 /100 | #251 | Tragic 5.7% |
| Sub-Saharan Africans | 2.1 /100 | #252 | Tragic 5.7% |
| Immigrants | Cuba | 1.6 /100 | #253 | Tragic 5.7% |
| Immigrants | Panama | 1.5 /100 | #254 | Tragic 5.7% |
| Yup'ik | 1.5 /100 | #255 | Tragic 5.7% |
| Immigrants | Turkey | 1.5 /100 | #256 | Tragic 5.7% |
| Immigrants | Northern Africa | 1.4 /100 | #257 | Tragic 5.6% |
| Immigrants | Lithuania | 1.4 /100 | #258 | Tragic 5.6% |
| Immigrants | France | 1.3 /100 | #259 | Tragic 5.6% |
| Uruguayans | 1.3 /100 | #260 | Tragic 5.6% |
| Sudanese | 1.2 /100 | #261 | Tragic 5.6% |
| Bermudans | 1.2 /100 | #262 | Tragic 5.6% |
| Immigrants | Saudi Arabia | 1.1 /100 | #263 | Tragic 5.6% |
| Immigrants | Africa | 1.0 /100 | #264 | Tragic 5.6% |
| South Americans | 0.9 /100 | #265 | Tragic 5.6% |
Demographics Similar to Mexican American Indians by 4 or more Vehicles in Household
In terms of 4 or more vehicles in household, the demographic groups most similar to Mexican American Indians are Sri Lankan (8.4%, a difference of 0.12%), Basque (8.4%, a difference of 0.31%), Immigrants from Central America (8.5%, a difference of 0.86%), Cheyenne (8.3%, a difference of 1.5%), and Immigrants from Philippines (8.5%, a difference of 1.7%).
| Demographics | Rating | Rank | 4 or more Vehicles in Household |
| Koreans | 100.0 /100 | #19 | Exceptional 8.6% |
| Pueblo | 100.0 /100 | #20 | Exceptional 8.6% |
| Danes | 100.0 /100 | #21 | Exceptional 8.6% |
| Immigrants | Vietnam | 100.0 /100 | #22 | Exceptional 8.6% |
| Immigrants | Philippines | 100.0 /100 | #23 | Exceptional 8.5% |
| Immigrants | Central America | 100.0 /100 | #24 | Exceptional 8.5% |
| Basques | 100.0 /100 | #25 | Exceptional 8.4% |
| Mexican American Indians | 100.0 /100 | #26 | Exceptional 8.4% |
| Sri Lankans | 100.0 /100 | #27 | Exceptional 8.4% |
| Cheyenne | 100.0 /100 | #28 | Exceptional 8.3% |
| Immigrants | South Eastern Asia | 100.0 /100 | #29 | Exceptional 8.2% |
| Navajo | 100.0 /100 | #30 | Exceptional 8.2% |
| Natives/Alaskans | 100.0 /100 | #31 | Exceptional 8.2% |
| Marshallese | 100.0 /100 | #32 | Exceptional 8.1% |
| Yaqui | 100.0 /100 | #33 | Exceptional 8.1% |