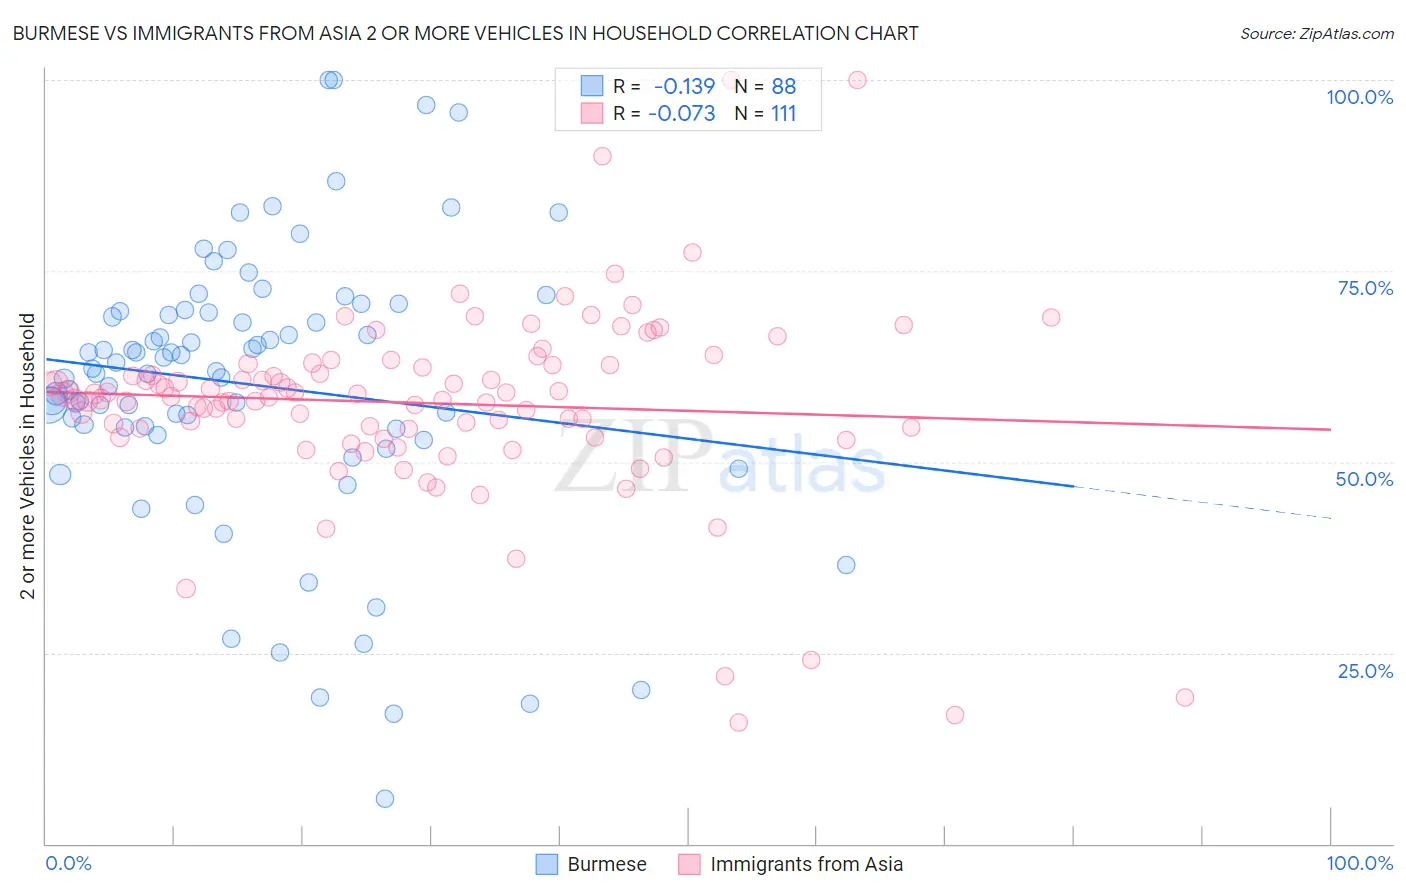
Burmese vs Immigrants from Asia 2 or more Vehicles in Household
COMPARE
Burmese
Immigrants from Asia
2 or more Vehicles in Household
2 or more Vehicles in Household Comparison
Burmese
Immigrants from Asia
57.8%
2 OR MORE VEHICLES IN HOUSEHOLD
98.8/ 100
METRIC RATING
96th/ 347
METRIC RANK
56.3%
2 OR MORE VEHICLES IN HOUSEHOLD
86.0/ 100
METRIC RATING
136th/ 347
METRIC RANK
Burmese vs Immigrants from Asia 2 or more Vehicles in Household Correlation Chart
The statistical analysis conducted on geographies consisting of 464,950,170 people shows a poor negative correlation between the proportion of Burmese and percentage of households with 2 or more vehicles available in the United States with a correlation coefficient (R) of -0.139 and weighted average of 57.8%. Similarly, the statistical analysis conducted on geographies consisting of 548,501,460 people shows a slight negative correlation between the proportion of Immigrants from Asia and percentage of households with 2 or more vehicles available in the United States with a correlation coefficient (R) of -0.073 and weighted average of 56.3%, a difference of 2.6%.
2 or more Vehicles in Household Correlation Summary
| Measurement | Burmese | Immigrants from Asia |
| Minimum | 5.9% | 15.8% |
| Maximum | 100.0% | 100.0% |
| Range | 94.1% | 84.2% |
| Mean | 60.1% | 57.7% |
| Median | 62.0% | 58.5% |
| Interquartile 25% (IQ1) | 54.5% | 54.4% |
| Interquartile 75% (IQ3) | 69.7% | 62.7% |
| Interquartile Range (IQR) | 15.2% | 8.2% |
| Standard Deviation (Sample) | 18.3% | 12.7% |
| Standard Deviation (Population) | 18.2% | 12.6% |
Similar Demographics by 2 or more Vehicles in Household
Demographics Similar to Burmese by 2 or more Vehicles in Household
In terms of 2 or more vehicles in household, the demographic groups most similar to Burmese are Slavic (57.8%, a difference of 0.020%), Hmong (57.8%, a difference of 0.030%), Filipino (57.8%, a difference of 0.060%), Shoshone (57.9%, a difference of 0.12%), and Ottawa (57.9%, a difference of 0.12%).
| Demographics | Rating | Rank | 2 or more Vehicles in Household |
| Immigrants | Germany | 99.0 /100 | #89 | Exceptional 57.9% |
| Hispanics or Latinos | 99.0 /100 | #90 | Exceptional 57.9% |
| Pakistanis | 99.0 /100 | #91 | Exceptional 57.9% |
| Shoshone | 99.0 /100 | #92 | Exceptional 57.9% |
| Ottawa | 99.0 /100 | #93 | Exceptional 57.9% |
| Filipinos | 98.9 /100 | #94 | Exceptional 57.8% |
| Hmong | 98.9 /100 | #95 | Exceptional 57.8% |
| Burmese | 98.8 /100 | #96 | Exceptional 57.8% |
| Slavs | 98.8 /100 | #97 | Exceptional 57.8% |
| Palestinians | 98.6 /100 | #98 | Exceptional 57.7% |
| Cajuns | 98.5 /100 | #99 | Exceptional 57.7% |
| Fijians | 98.4 /100 | #100 | Exceptional 57.6% |
| Lebanese | 98.3 /100 | #101 | Exceptional 57.6% |
| Immigrants | Bolivia | 98.2 /100 | #102 | Exceptional 57.6% |
| Jordanians | 98.2 /100 | #103 | Exceptional 57.6% |
Demographics Similar to Immigrants from Asia by 2 or more Vehicles in Household
In terms of 2 or more vehicles in household, the demographic groups most similar to Immigrants from Asia are Blackfeet (56.4%, a difference of 0.040%), Immigrants from the Azores (56.4%, a difference of 0.050%), Cuban (56.3%, a difference of 0.090%), Salvadoran (56.3%, a difference of 0.10%), and Armenian (56.3%, a difference of 0.13%).
| Demographics | Rating | Rank | 2 or more Vehicles in Household |
| Ute | 90.4 /100 | #129 | Exceptional 56.6% |
| Yugoslavians | 90.0 /100 | #130 | Exceptional 56.6% |
| Bulgarians | 89.7 /100 | #131 | Excellent 56.5% |
| Hungarians | 89.1 /100 | #132 | Excellent 56.5% |
| Comanche | 88.4 /100 | #133 | Excellent 56.5% |
| Immigrants | Azores | 86.6 /100 | #134 | Excellent 56.4% |
| Blackfeet | 86.5 /100 | #135 | Excellent 56.4% |
| Immigrants | Asia | 86.0 /100 | #136 | Excellent 56.3% |
| Cubans | 84.8 /100 | #137 | Excellent 56.3% |
| Salvadorans | 84.7 /100 | #138 | Excellent 56.3% |
| Armenians | 84.3 /100 | #139 | Excellent 56.3% |
| Latvians | 83.6 /100 | #140 | Excellent 56.2% |
| Immigrants | Cambodia | 83.6 /100 | #141 | Excellent 56.2% |
| South Africans | 83.1 /100 | #142 | Excellent 56.2% |
| Seminole | 81.7 /100 | #143 | Excellent 56.2% |