Immigrants from Laos vs German Associate's Degree
COMPARE
Immigrants from Laos
German
Associate's Degree
Associate's Degree Comparison
Immigrants from Laos
Germans
40.7%
ASSOCIATE'S DEGREE
0.1/ 100
METRIC RATING
271st/ 347
METRIC RANK
45.5%
ASSOCIATE'S DEGREE
26.5/ 100
METRIC RATING
195th/ 347
METRIC RANK
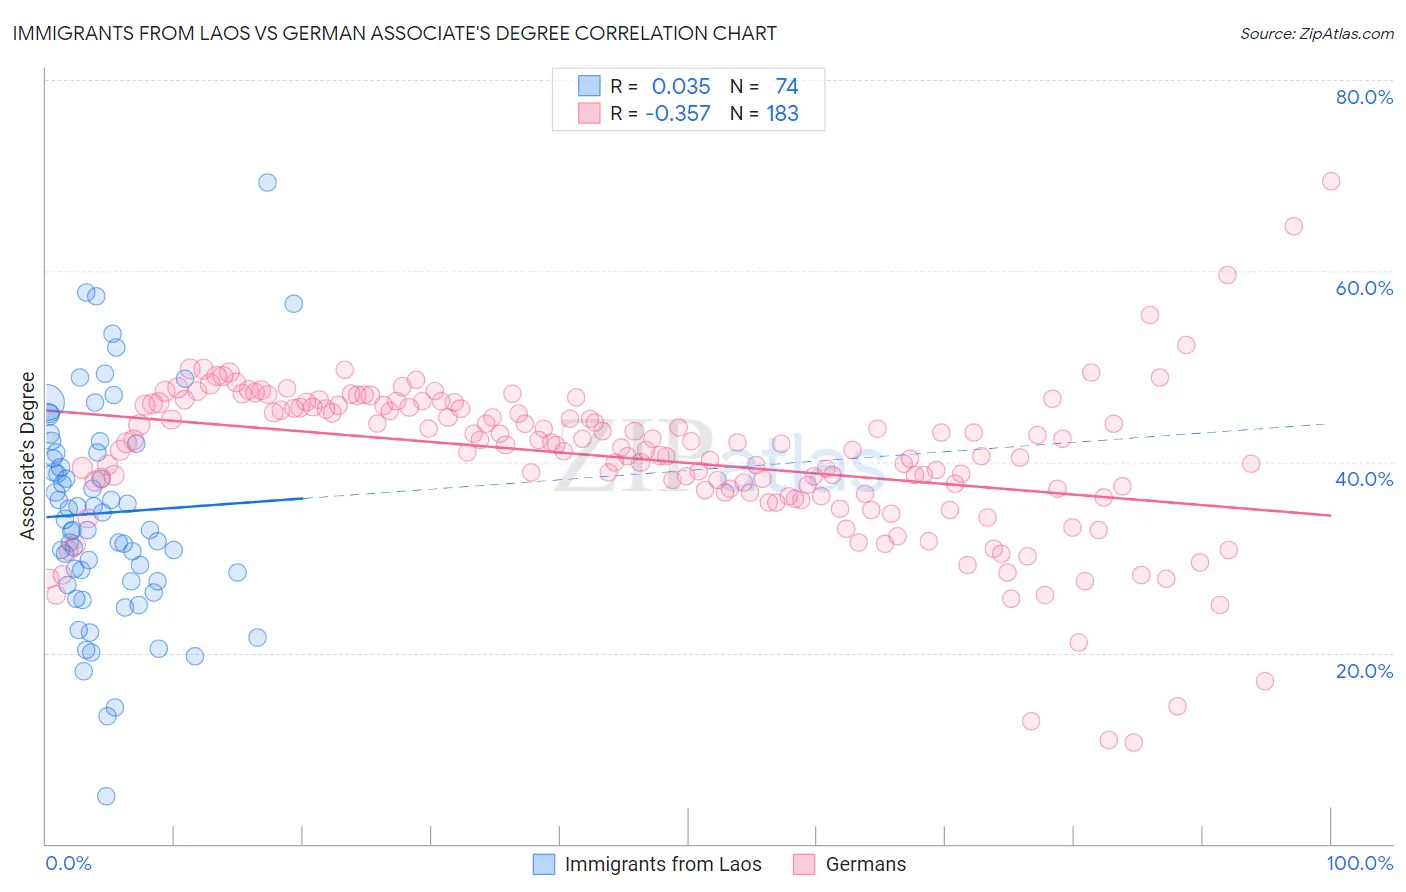
Immigrants from Laos vs German Associate's Degree Correlation Chart
The statistical analysis conducted on geographies consisting of 201,474,630 people shows no correlation between the proportion of Immigrants from Laos and percentage of population with at least associate's degree education in the United States with a correlation coefficient (R) of 0.035 and weighted average of 40.7%. Similarly, the statistical analysis conducted on geographies consisting of 581,143,634 people shows a mild negative correlation between the proportion of Germans and percentage of population with at least associate's degree education in the United States with a correlation coefficient (R) of -0.357 and weighted average of 45.5%, a difference of 11.8%.
Associate's Degree Correlation Summary
| Measurement | Immigrants from Laos | German |
| Minimum | 5.0% | 10.6% |
| Maximum | 69.3% | 69.4% |
| Range | 64.3% | 58.8% |
| Mean | 34.7% | 40.3% |
| Median | 33.4% | 41.8% |
| Interquartile 25% (IQ1) | 27.5% | 36.7% |
| Interquartile 75% (IQ3) | 41.0% | 45.9% |
| Interquartile Range (IQR) | 13.5% | 9.2% |
| Standard Deviation (Sample) | 11.3% | 8.3% |
| Standard Deviation (Population) | 11.2% | 8.3% |
Similar Demographics by Associate's Degree
Demographics Similar to Immigrants from Laos by Associate's Degree
In terms of associate's degree, the demographic groups most similar to Immigrants from Laos are Belizean (40.6%, a difference of 0.070%), Chippewa (40.7%, a difference of 0.18%), American (40.8%, a difference of 0.23%), Puget Sound Salish (40.5%, a difference of 0.36%), and Central American Indian (40.8%, a difference of 0.41%).
| Demographics | Rating | Rank | Associate's Degree |
| Osage | 0.3 /100 | #264 | Tragic 41.5% |
| Africans | 0.2 /100 | #265 | Tragic 41.1% |
| Samoans | 0.2 /100 | #266 | Tragic 41.1% |
| Hawaiians | 0.2 /100 | #267 | Tragic 40.9% |
| Central American Indians | 0.2 /100 | #268 | Tragic 40.8% |
| Americans | 0.2 /100 | #269 | Tragic 40.8% |
| Chippewa | 0.2 /100 | #270 | Tragic 40.7% |
| Immigrants | Laos | 0.1 /100 | #271 | Tragic 40.7% |
| Belizeans | 0.1 /100 | #272 | Tragic 40.6% |
| Puget Sound Salish | 0.1 /100 | #273 | Tragic 40.5% |
| Immigrants | Dominica | 0.1 /100 | #274 | Tragic 40.5% |
| Potawatomi | 0.1 /100 | #275 | Tragic 40.4% |
| Puerto Ricans | 0.1 /100 | #276 | Tragic 40.4% |
| Blackfeet | 0.1 /100 | #277 | Tragic 40.3% |
| Ottawa | 0.1 /100 | #278 | Tragic 40.3% |
Demographics Similar to Germans by Associate's Degree
In terms of associate's degree, the demographic groups most similar to Germans are French (45.4%, a difference of 0.090%), Immigrants from Peru (45.5%, a difference of 0.10%), Immigrants from Cameroon (45.7%, a difference of 0.42%), Scotch-Irish (45.3%, a difference of 0.44%), and Immigrants from Bangladesh (45.2%, a difference of 0.54%).
| Demographics | Rating | Rank | Associate's Degree |
| Ghanaians | 35.5 /100 | #188 | Fair 45.8% |
| Immigrants | Oceania | 34.7 /100 | #189 | Fair 45.8% |
| Vietnamese | 34.0 /100 | #190 | Fair 45.8% |
| Koreans | 33.8 /100 | #191 | Fair 45.8% |
| Celtics | 33.3 /100 | #192 | Fair 45.8% |
| Immigrants | Cameroon | 31.0 /100 | #193 | Fair 45.7% |
| Immigrants | Peru | 27.6 /100 | #194 | Fair 45.5% |
| Germans | 26.5 /100 | #195 | Fair 45.5% |
| French | 25.6 /100 | #196 | Fair 45.4% |
| Scotch-Irish | 22.3 /100 | #197 | Fair 45.3% |
| Immigrants | Bangladesh | 21.3 /100 | #198 | Fair 45.2% |
| Immigrants | Senegal | 21.2 /100 | #199 | Fair 45.2% |
| Senegalese | 21.1 /100 | #200 | Fair 45.2% |
| Immigrants | Vietnam | 20.8 /100 | #201 | Fair 45.2% |
| Spaniards | 20.4 /100 | #202 | Fair 45.2% |