Immigrants from Kuwait vs Panamanian Disability Age Over 75
COMPARE
Immigrants from Kuwait
Panamanian
Disability Age Over 75
Disability Age Over 75 Comparison
Immigrants from Kuwait
Panamanians
46.4%
DISABILITY AGE OVER 75
96.8/ 100
METRIC RATING
106th/ 347
METRIC RANK
47.9%
DISABILITY AGE OVER 75
11.8/ 100
METRIC RATING
211th/ 347
METRIC RANK
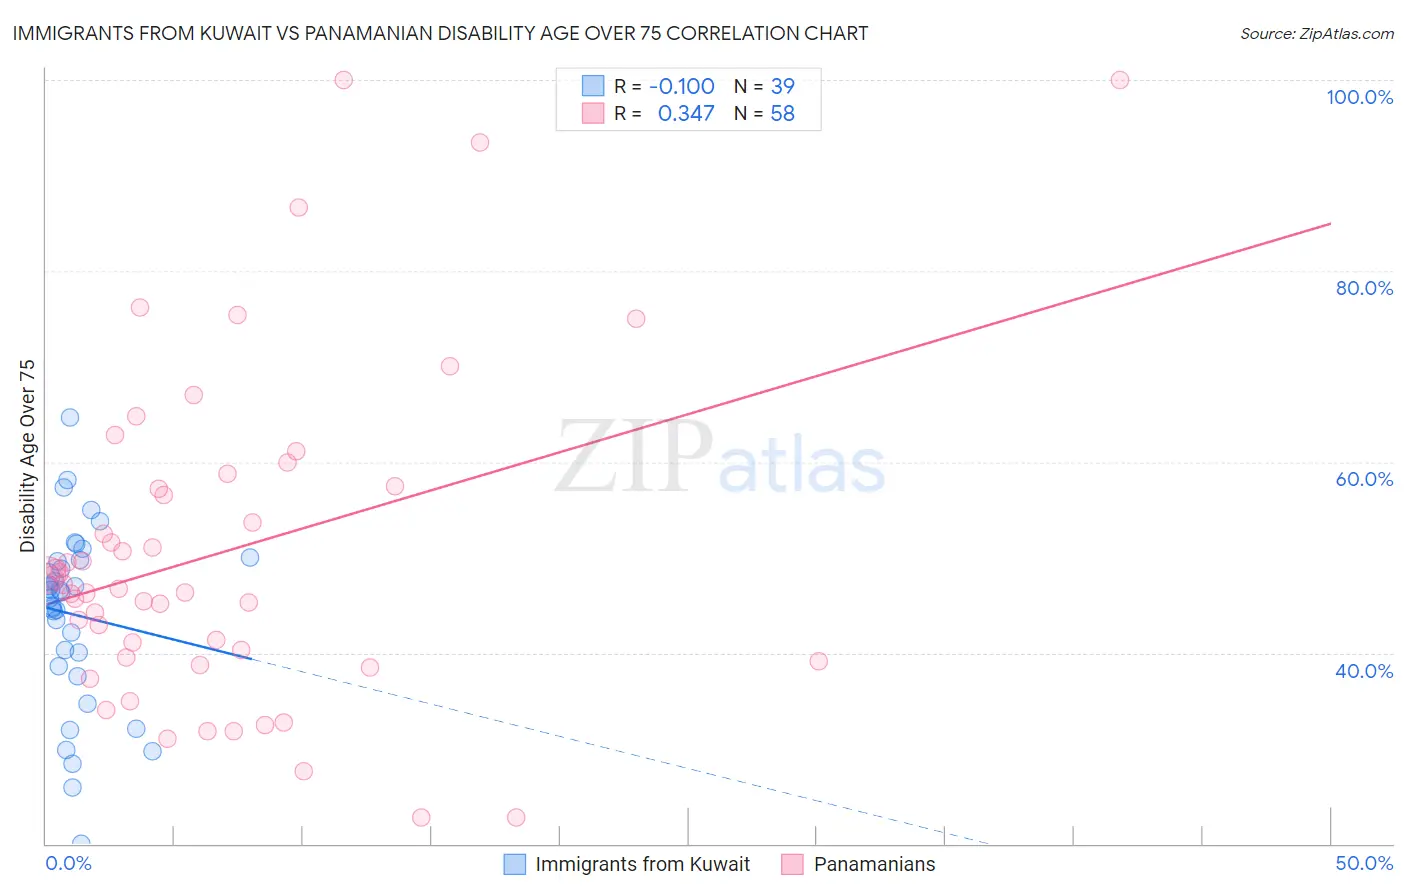
Immigrants from Kuwait vs Panamanian Disability Age Over 75 Correlation Chart
The statistical analysis conducted on geographies consisting of 136,863,821 people shows a slight negative correlation between the proportion of Immigrants from Kuwait and percentage of population with a disability over the age of 75 in the United States with a correlation coefficient (R) of -0.100 and weighted average of 46.4%. Similarly, the statistical analysis conducted on geographies consisting of 280,678,254 people shows a mild positive correlation between the proportion of Panamanians and percentage of population with a disability over the age of 75 in the United States with a correlation coefficient (R) of 0.347 and weighted average of 47.9%, a difference of 3.1%.
Disability Age Over 75 Correlation Summary
| Measurement | Immigrants from Kuwait | Panamanian |
| Minimum | 20.1% | 22.7% |
| Maximum | 64.6% | 100.0% |
| Range | 44.6% | 77.3% |
| Mean | 44.0% | 50.6% |
| Median | 46.3% | 47.0% |
| Interquartile 25% (IQ1) | 38.6% | 39.4% |
| Interquartile 75% (IQ3) | 49.7% | 57.4% |
| Interquartile Range (IQR) | 11.1% | 18.0% |
| Standard Deviation (Sample) | 9.5% | 17.3% |
| Standard Deviation (Population) | 9.4% | 17.1% |
Similar Demographics by Disability Age Over 75
Demographics Similar to Immigrants from Kuwait by Disability Age Over 75
In terms of disability age over 75, the demographic groups most similar to Immigrants from Kuwait are Immigrants from Cameroon (46.4%, a difference of 0.010%), Immigrants from Uruguay (46.4%, a difference of 0.030%), Israeli (46.4%, a difference of 0.040%), Brazilian (46.5%, a difference of 0.040%), and Ukrainian (46.4%, a difference of 0.050%).
| Demographics | Rating | Rank | Disability Age Over 75 |
| Palestinians | 97.7 /100 | #99 | Exceptional 46.3% |
| Immigrants | Eastern Europe | 97.7 /100 | #100 | Exceptional 46.3% |
| Mongolians | 97.7 /100 | #101 | Exceptional 46.3% |
| Immigrants | Malaysia | 97.1 /100 | #102 | Exceptional 46.4% |
| Ukrainians | 97.1 /100 | #103 | Exceptional 46.4% |
| Israelis | 97.0 /100 | #104 | Exceptional 46.4% |
| Immigrants | Cameroon | 96.9 /100 | #105 | Exceptional 46.4% |
| Immigrants | Kuwait | 96.8 /100 | #106 | Exceptional 46.4% |
| Immigrants | Uruguay | 96.7 /100 | #107 | Exceptional 46.4% |
| Brazilians | 96.6 /100 | #108 | Exceptional 46.5% |
| Chileans | 96.4 /100 | #109 | Exceptional 46.5% |
| Immigrants | Hong Kong | 96.4 /100 | #110 | Exceptional 46.5% |
| Immigrants | Chile | 96.4 /100 | #111 | Exceptional 46.5% |
| Immigrants | Pakistan | 96.1 /100 | #112 | Exceptional 46.5% |
| Irish | 96.0 /100 | #113 | Exceptional 46.5% |
Demographics Similar to Panamanians by Disability Age Over 75
In terms of disability age over 75, the demographic groups most similar to Panamanians are Immigrants from Burma/Myanmar (47.9%, a difference of 0.0%), Vietnamese (47.9%, a difference of 0.010%), Laotian (47.9%, a difference of 0.020%), Immigrants from Barbados (47.9%, a difference of 0.060%), and Senegalese (47.9%, a difference of 0.060%).
| Demographics | Rating | Rank | Disability Age Over 75 |
| Nigerians | 19.2 /100 | #204 | Poor 47.7% |
| Immigrants | Ghana | 19.1 /100 | #205 | Poor 47.7% |
| Jamaicans | 19.0 /100 | #206 | Poor 47.7% |
| Immigrants | Syria | 17.4 /100 | #207 | Poor 47.8% |
| Immigrants | Senegal | 16.9 /100 | #208 | Poor 47.8% |
| Immigrants | Indonesia | 14.2 /100 | #209 | Poor 47.8% |
| Vietnamese | 11.9 /100 | #210 | Poor 47.9% |
| Panamanians | 11.8 /100 | #211 | Poor 47.9% |
| Immigrants | Burma/Myanmar | 11.7 /100 | #212 | Poor 47.9% |
| Laotians | 11.5 /100 | #213 | Poor 47.9% |
| Immigrants | Barbados | 10.7 /100 | #214 | Poor 47.9% |
| Senegalese | 10.7 /100 | #215 | Poor 47.9% |
| Immigrants | Panama | 10.2 /100 | #216 | Poor 47.9% |
| Immigrants | Grenada | 9.4 /100 | #217 | Tragic 47.9% |
| Immigrants | Western Africa | 8.3 /100 | #218 | Tragic 48.0% |