Slovene vs Panamanian 1 or more Vehicles in Household
COMPARE
Slovene
Panamanian
1 or more Vehicles in Household
1 or more Vehicles in Household Comparison
Slovenes
Panamanians
92.0%
1 OR MORE VEHICLES IN HOUSEHOLD
99.9/ 100
METRIC RATING
54th/ 347
METRIC RANK
87.5%
1 OR MORE VEHICLES IN HOUSEHOLD
0.2/ 100
METRIC RATING
270th/ 347
METRIC RANK
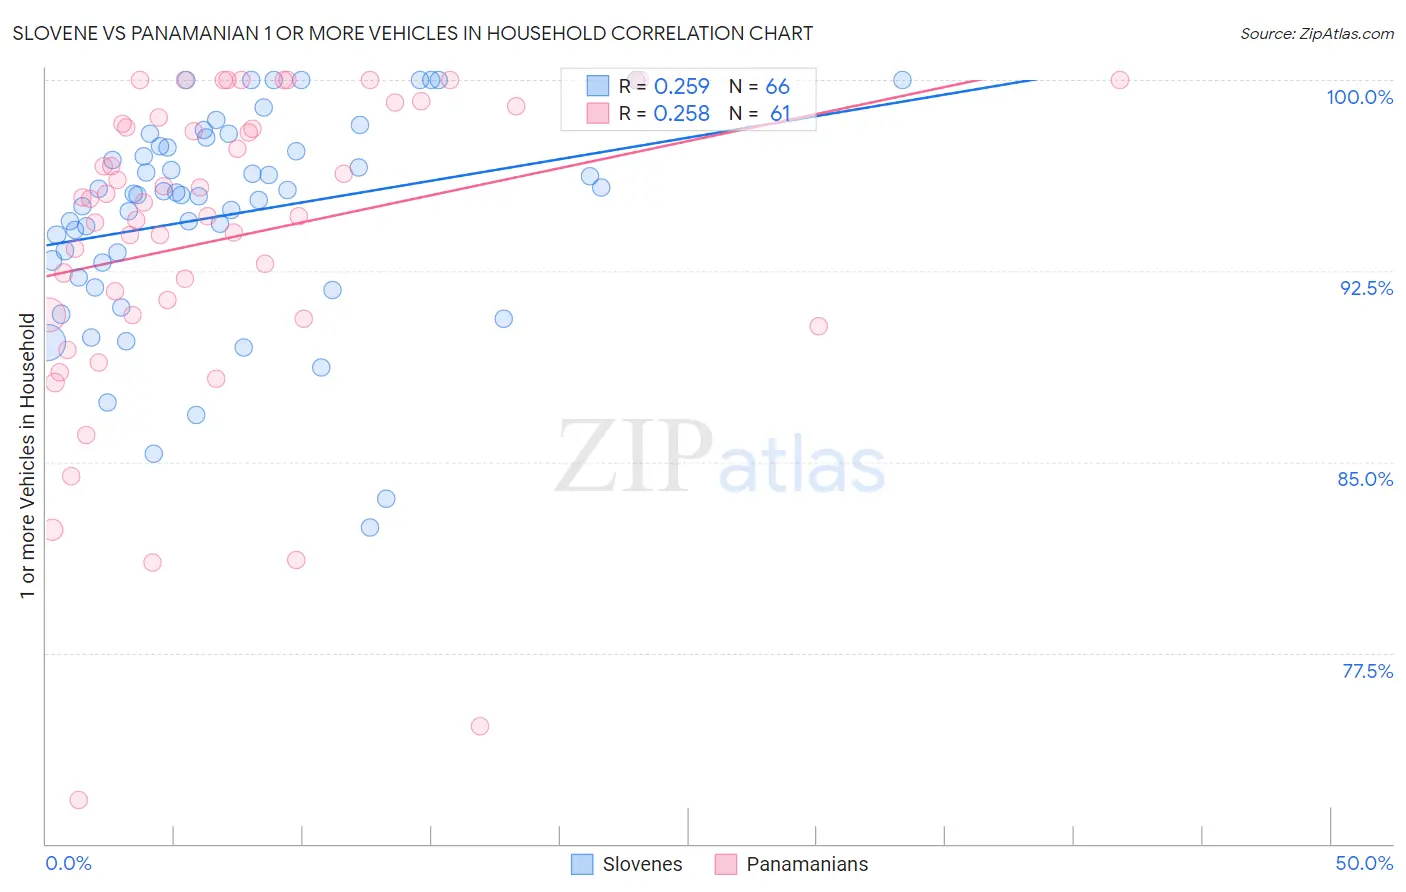
Slovene vs Panamanian 1 or more Vehicles in Household Correlation Chart
The statistical analysis conducted on geographies consisting of 261,275,644 people shows a weak positive correlation between the proportion of Slovenes and percentage of households with 1 or more vehicles available in the United States with a correlation coefficient (R) of 0.259 and weighted average of 92.0%. Similarly, the statistical analysis conducted on geographies consisting of 281,086,843 people shows a weak positive correlation between the proportion of Panamanians and percentage of households with 1 or more vehicles available in the United States with a correlation coefficient (R) of 0.258 and weighted average of 87.5%, a difference of 5.1%.
1 or more Vehicles in Household Correlation Summary
| Measurement | Slovene | Panamanian |
| Minimum | 82.4% | 71.7% |
| Maximum | 100.0% | 100.0% |
| Range | 17.6% | 28.3% |
| Mean | 94.7% | 93.8% |
| Median | 95.5% | 95.3% |
| Interquartile 25% (IQ1) | 92.8% | 90.8% |
| Interquartile 75% (IQ3) | 97.4% | 98.7% |
| Interquartile Range (IQR) | 4.5% | 8.0% |
| Standard Deviation (Sample) | 4.1% | 6.3% |
| Standard Deviation (Population) | 4.1% | 6.2% |
Similar Demographics by 1 or more Vehicles in Household
Demographics Similar to Slovenes by 1 or more Vehicles in Household
In terms of 1 or more vehicles in household, the demographic groups most similar to Slovenes are Hawaiian (92.0%, a difference of 0.010%), Korean (92.1%, a difference of 0.040%), Celtic (92.1%, a difference of 0.060%), Immigrants from Afghanistan (92.0%, a difference of 0.060%), and Immigrants from Venezuela (92.0%, a difference of 0.060%).
| Demographics | Rating | Rank | 1 or more Vehicles in Household |
| Northern Europeans | 99.9 /100 | #47 | Exceptional 92.2% |
| Belgians | 99.9 /100 | #48 | Exceptional 92.1% |
| Afghans | 99.9 /100 | #49 | Exceptional 92.1% |
| Guamanians/Chamorros | 99.9 /100 | #50 | Exceptional 92.1% |
| Celtics | 99.9 /100 | #51 | Exceptional 92.1% |
| Koreans | 99.9 /100 | #52 | Exceptional 92.1% |
| Hawaiians | 99.9 /100 | #53 | Exceptional 92.0% |
| Slovenes | 99.9 /100 | #54 | Exceptional 92.0% |
| Immigrants | Afghanistan | 99.9 /100 | #55 | Exceptional 92.0% |
| Immigrants | Venezuela | 99.9 /100 | #56 | Exceptional 92.0% |
| Iraqis | 99.8 /100 | #57 | Exceptional 91.9% |
| Immigrants | Mexico | 99.8 /100 | #58 | Exceptional 91.9% |
| Venezuelans | 99.8 /100 | #59 | Exceptional 91.9% |
| Slovaks | 99.8 /100 | #60 | Exceptional 91.9% |
| Immigrants | India | 99.8 /100 | #61 | Exceptional 91.9% |
Demographics Similar to Panamanians by 1 or more Vehicles in Household
In terms of 1 or more vehicles in household, the demographic groups most similar to Panamanians are Immigrants from Africa (87.6%, a difference of 0.010%), Bermudan (87.5%, a difference of 0.010%), Immigrants from Europe (87.6%, a difference of 0.060%), Aleut (87.5%, a difference of 0.070%), and Immigrants from Colombia (87.6%, a difference of 0.10%).
| Demographics | Rating | Rank | 1 or more Vehicles in Household |
| Immigrants | Egypt | 0.5 /100 | #263 | Tragic 87.8% |
| Immigrants | Liberia | 0.4 /100 | #264 | Tragic 87.8% |
| Africans | 0.4 /100 | #265 | Tragic 87.8% |
| Israelis | 0.3 /100 | #266 | Tragic 87.7% |
| Immigrants | Colombia | 0.3 /100 | #267 | Tragic 87.6% |
| Immigrants | Europe | 0.2 /100 | #268 | Tragic 87.6% |
| Immigrants | Africa | 0.2 /100 | #269 | Tragic 87.6% |
| Panamanians | 0.2 /100 | #270 | Tragic 87.5% |
| Bermudans | 0.2 /100 | #271 | Tragic 87.5% |
| Aleuts | 0.2 /100 | #272 | Tragic 87.5% |
| Immigrants | Northern Africa | 0.2 /100 | #273 | Tragic 87.4% |
| Immigrants | Morocco | 0.1 /100 | #274 | Tragic 87.4% |
| Immigrants | Singapore | 0.1 /100 | #275 | Tragic 87.2% |
| Immigrants | France | 0.1 /100 | #276 | Tragic 87.1% |
| Alsatians | 0.1 /100 | #277 | Tragic 87.1% |