Immigrants from Iraq vs Albanian Receiving Food Stamps
COMPARE
Immigrants from Iraq
Albanian
Receiving Food Stamps
Receiving Food Stamps Comparison
Immigrants from Iraq
Albanians
12.0%
RECEIVING FOOD STAMPS
37.1/ 100
METRIC RATING
185th/ 347
METRIC RANK
12.0%
RECEIVING FOOD STAMPS
35.4/ 100
METRIC RATING
187th/ 347
METRIC RANK
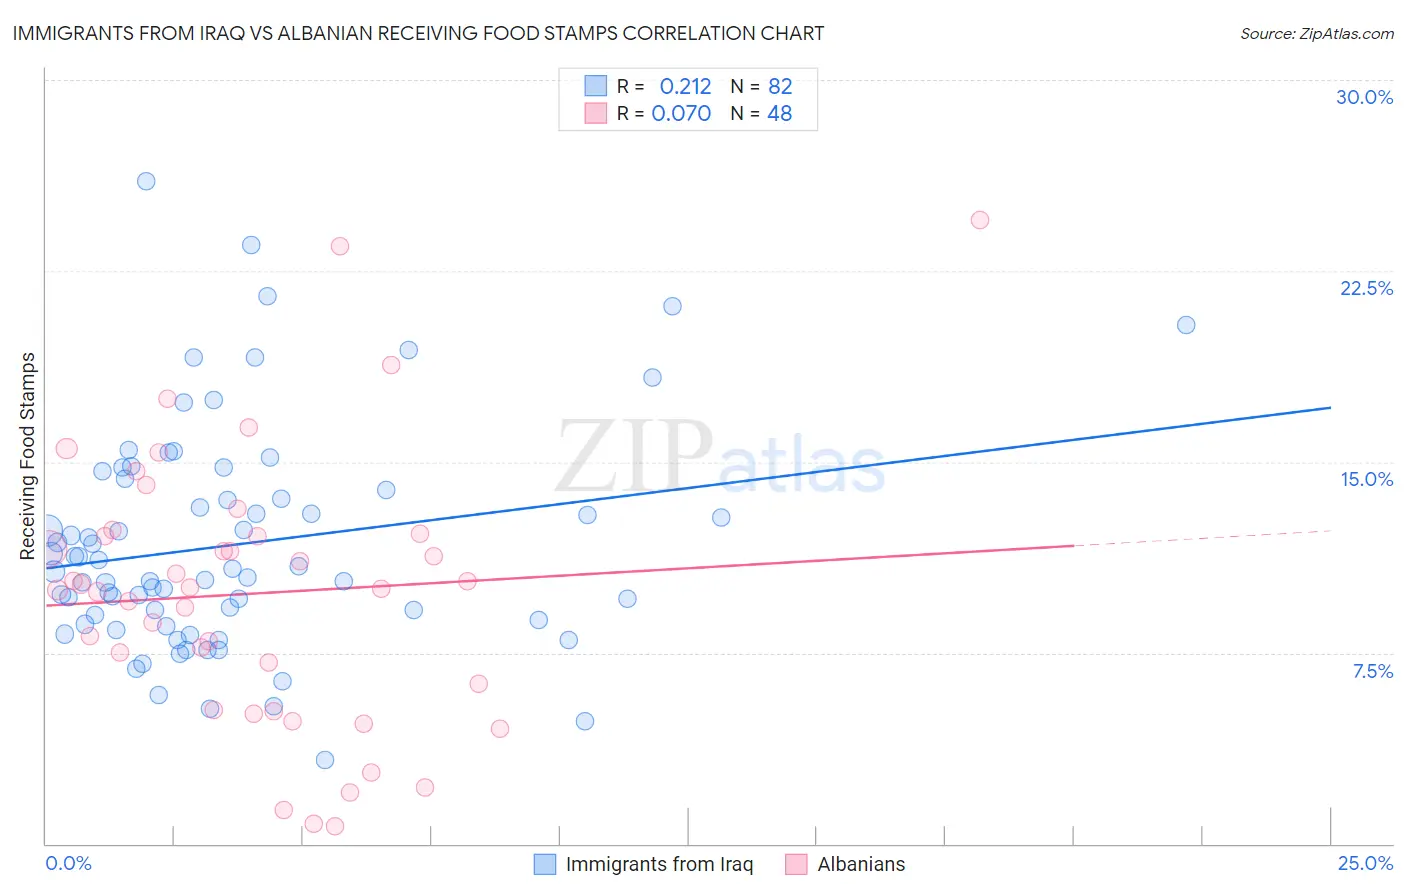
Immigrants from Iraq vs Albanian Receiving Food Stamps Correlation Chart
The statistical analysis conducted on geographies consisting of 194,550,826 people shows a weak positive correlation between the proportion of Immigrants from Iraq and percentage of population receiving government assistance and/or food stamps in the United States with a correlation coefficient (R) of 0.212 and weighted average of 12.0%. Similarly, the statistical analysis conducted on geographies consisting of 192,875,347 people shows a slight positive correlation between the proportion of Albanians and percentage of population receiving government assistance and/or food stamps in the United States with a correlation coefficient (R) of 0.070 and weighted average of 12.0%, a difference of 0.25%.
Receiving Food Stamps Correlation Summary
| Measurement | Immigrants from Iraq | Albanian |
| Minimum | 3.3% | 0.70% |
| Maximum | 26.0% | 24.5% |
| Range | 22.7% | 23.8% |
| Mean | 11.7% | 9.8% |
| Median | 10.7% | 10.0% |
| Interquartile 25% (IQ1) | 8.8% | 5.8% |
| Interquartile 75% (IQ3) | 13.9% | 12.2% |
| Interquartile Range (IQR) | 5.1% | 6.4% |
| Standard Deviation (Sample) | 4.4% | 5.3% |
| Standard Deviation (Population) | 4.4% | 5.2% |
Demographics Similar to Immigrants from Iraq and Albanians by Receiving Food Stamps
In terms of receiving food stamps, the demographic groups most similar to Immigrants from Iraq are Spanish (12.0%, a difference of 0.040%), Spaniard (11.9%, a difference of 0.38%), Immigrants from Uganda (11.9%, a difference of 0.46%), Immigrants from Morocco (11.9%, a difference of 0.52%), and Sudanese (12.0%, a difference of 0.56%). Similarly, the demographic groups most similar to Albanians are Spanish (12.0%, a difference of 0.22%), Sudanese (12.0%, a difference of 0.31%), Immigrants from Cameroon (12.0%, a difference of 0.44%), Immigrants from Peru (12.0%, a difference of 0.50%), and Venezuelan (12.0%, a difference of 0.51%).
| Demographics | Rating | Rank | Receiving Food Stamps |
| Peruvians | 49.3 /100 | #176 | Average 11.7% |
| Immigrants | Ukraine | 48.4 /100 | #177 | Average 11.8% |
| German Russians | 48.1 /100 | #178 | Average 11.8% |
| Immigrants | Kenya | 46.4 /100 | #179 | Average 11.8% |
| Uruguayans | 44.8 /100 | #180 | Average 11.8% |
| South American Indians | 41.7 /100 | #181 | Average 11.9% |
| Immigrants | Morocco | 40.7 /100 | #182 | Average 11.9% |
| Immigrants | Uganda | 40.3 /100 | #183 | Average 11.9% |
| Spaniards | 39.8 /100 | #184 | Fair 11.9% |
| Immigrants | Iraq | 37.1 /100 | #185 | Fair 12.0% |
| Spanish | 36.9 /100 | #186 | Fair 12.0% |
| Albanians | 35.4 /100 | #187 | Fair 12.0% |
| Sudanese | 33.4 /100 | #188 | Fair 12.0% |
| Immigrants | Cameroon | 32.5 /100 | #189 | Fair 12.0% |
| Immigrants | Peru | 32.2 /100 | #190 | Fair 12.0% |
| Venezuelans | 32.1 /100 | #191 | Fair 12.0% |
| Samoans | 31.0 /100 | #192 | Fair 12.1% |
| Immigrants | Fiji | 27.8 /100 | #193 | Fair 12.1% |
| Immigrants | Sudan | 27.1 /100 | #194 | Fair 12.1% |
| Americans | 26.7 /100 | #195 | Fair 12.2% |
| Iraqis | 26.6 /100 | #196 | Fair 12.2% |