Immigrants from Australia vs Malaysian 4 or more Vehicles in Household
COMPARE
Immigrants from Australia
Malaysian
4 or more Vehicles in Household
4 or more Vehicles in Household Comparison
Immigrants from Australia
Malaysians
5.8%
4 OR MORE VEHICLES IN HOUSEHOLD
3.8/ 100
METRIC RATING
239th/ 347
METRIC RANK
7.7%
4 OR MORE VEHICLES IN HOUSEHOLD
100.0/ 100
METRIC RATING
53rd/ 347
METRIC RANK
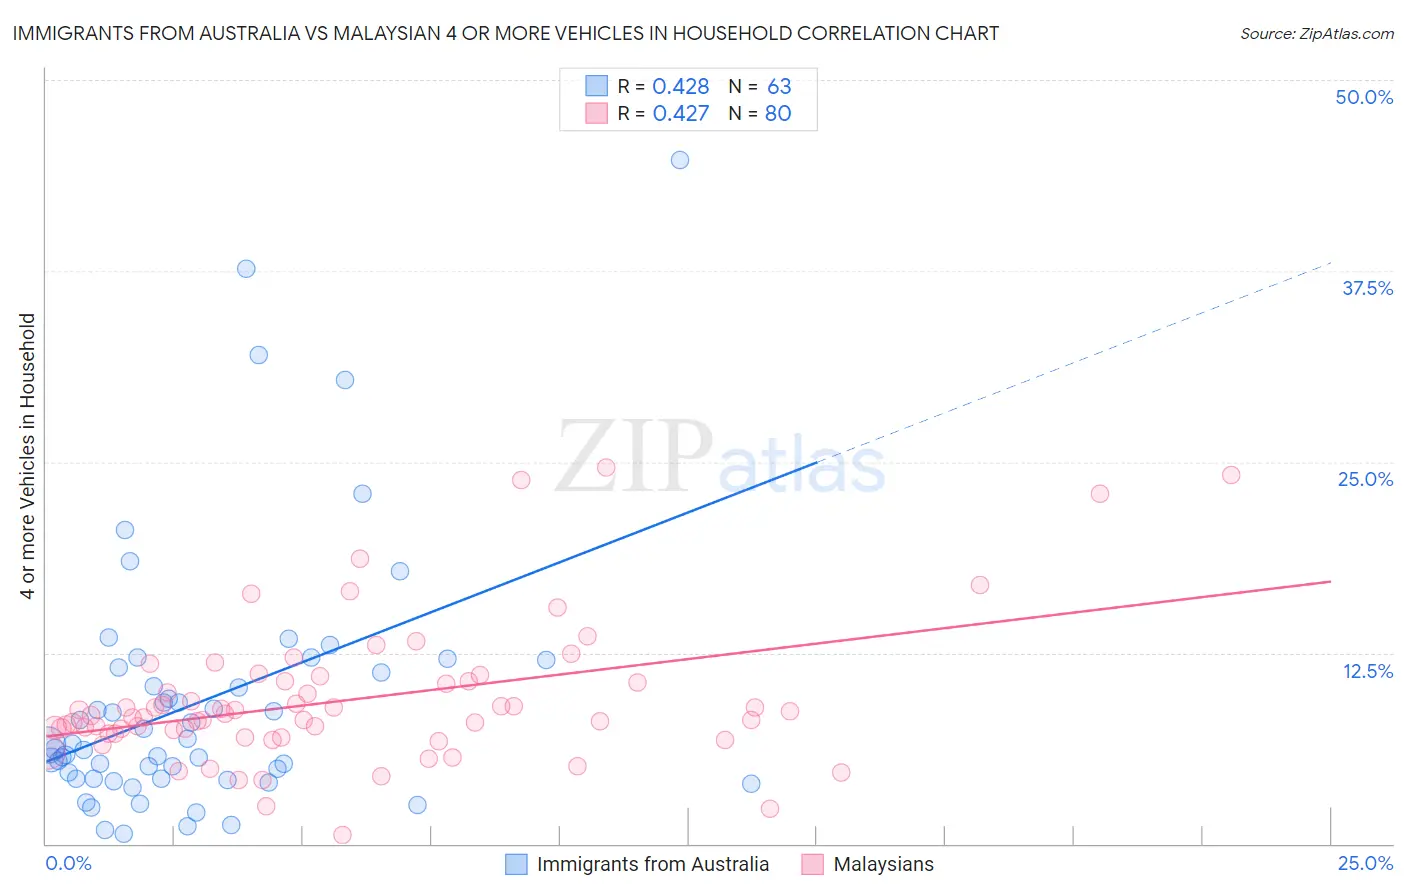
Immigrants from Australia vs Malaysian 4 or more Vehicles in Household Correlation Chart
The statistical analysis conducted on geographies consisting of 226,216,978 people shows a moderate positive correlation between the proportion of Immigrants from Australia and percentage of households with 4 or more vehicles available in the United States with a correlation coefficient (R) of 0.428 and weighted average of 5.8%. Similarly, the statistical analysis conducted on geographies consisting of 225,515,285 people shows a moderate positive correlation between the proportion of Malaysians and percentage of households with 4 or more vehicles available in the United States with a correlation coefficient (R) of 0.427 and weighted average of 7.7%, a difference of 31.9%.
4 or more Vehicles in Household Correlation Summary
| Measurement | Immigrants from Australia | Malaysian |
| Minimum | 0.65% | 0.58% |
| Maximum | 44.7% | 24.7% |
| Range | 44.1% | 24.1% |
| Mean | 9.3% | 9.4% |
| Median | 6.5% | 8.3% |
| Interquartile 25% (IQ1) | 4.2% | 7.2% |
| Interquartile 75% (IQ3) | 11.6% | 10.6% |
| Interquartile Range (IQR) | 7.3% | 3.4% |
| Standard Deviation (Sample) | 8.6% | 4.6% |
| Standard Deviation (Population) | 8.5% | 4.6% |
Similar Demographics by 4 or more Vehicles in Household
Demographics Similar to Immigrants from Australia by 4 or more Vehicles in Household
In terms of 4 or more vehicles in household, the demographic groups most similar to Immigrants from Australia are Immigrants from Poland (5.8%, a difference of 0.040%), Immigrants from Belgium (5.8%, a difference of 0.090%), Mongolian (5.8%, a difference of 0.14%), Turkish (5.8%, a difference of 0.22%), and Immigrants from Middle Africa (5.8%, a difference of 0.35%).
| Demographics | Rating | Rank | 4 or more Vehicles in Household |
| Immigrants | Argentina | 6.0 /100 | #232 | Tragic 5.9% |
| Sierra Leoneans | 6.0 /100 | #233 | Tragic 5.9% |
| Africans | 4.6 /100 | #234 | Tragic 5.8% |
| Immigrants | Hungary | 4.6 /100 | #235 | Tragic 5.8% |
| Immigrants | Eritrea | 4.5 /100 | #236 | Tragic 5.8% |
| Turks | 4.1 /100 | #237 | Tragic 5.8% |
| Immigrants | Belgium | 4.0 /100 | #238 | Tragic 5.8% |
| Immigrants | Australia | 3.8 /100 | #239 | Tragic 5.8% |
| Immigrants | Poland | 3.8 /100 | #240 | Tragic 5.8% |
| Mongolians | 3.7 /100 | #241 | Tragic 5.8% |
| Immigrants | Middle Africa | 3.4 /100 | #242 | Tragic 5.8% |
| Immigrants | Czechoslovakia | 3.2 /100 | #243 | Tragic 5.8% |
| Ethiopians | 3.2 /100 | #244 | Tragic 5.8% |
| Bulgarians | 3.1 /100 | #245 | Tragic 5.8% |
| Immigrants | North Macedonia | 2.5 /100 | #246 | Tragic 5.7% |
Demographics Similar to Malaysians by 4 or more Vehicles in Household
In terms of 4 or more vehicles in household, the demographic groups most similar to Malaysians are Dutch (7.7%, a difference of 0.070%), Japanese (7.7%, a difference of 0.38%), Immigrants from Oceania (7.6%, a difference of 0.47%), English (7.6%, a difference of 0.48%), and Immigrants from Laos (7.7%, a difference of 0.50%).
| Demographics | Rating | Rank | 4 or more Vehicles in Household |
| Crow | 100.0 /100 | #46 | Exceptional 7.8% |
| Osage | 100.0 /100 | #47 | Exceptional 7.8% |
| Swiss | 100.0 /100 | #48 | Exceptional 7.8% |
| Cherokee | 100.0 /100 | #49 | Exceptional 7.7% |
| Immigrants | El Salvador | 100.0 /100 | #50 | Exceptional 7.7% |
| Immigrants | Laos | 100.0 /100 | #51 | Exceptional 7.7% |
| Japanese | 100.0 /100 | #52 | Exceptional 7.7% |
| Malaysians | 100.0 /100 | #53 | Exceptional 7.7% |
| Dutch | 100.0 /100 | #54 | Exceptional 7.7% |
| Immigrants | Oceania | 100.0 /100 | #55 | Exceptional 7.6% |
| English | 100.0 /100 | #56 | Exceptional 7.6% |
| Pennsylvania Germans | 100.0 /100 | #57 | Exceptional 7.6% |
| Swedes | 100.0 /100 | #58 | Exceptional 7.6% |
| Hispanics or Latinos | 100.0 /100 | #59 | Exceptional 7.6% |
| Spaniards | 100.0 /100 | #60 | Exceptional 7.6% |