Immigrants from Fiji vs Palestinian 3 or more Vehicles in Household
COMPARE
Immigrants from Fiji
Palestinian
3 or more Vehicles in Household
3 or more Vehicles in Household Comparison
Immigrants from Fiji
Palestinians
26.1%
3 OR MORE VEHICLES IN HOUSEHOLD
100.0/ 100
METRIC RATING
6th/ 347
METRIC RANK
20.1%
3 OR MORE VEHICLES IN HOUSEHOLD
83.9/ 100
METRIC RATING
145th/ 347
METRIC RANK
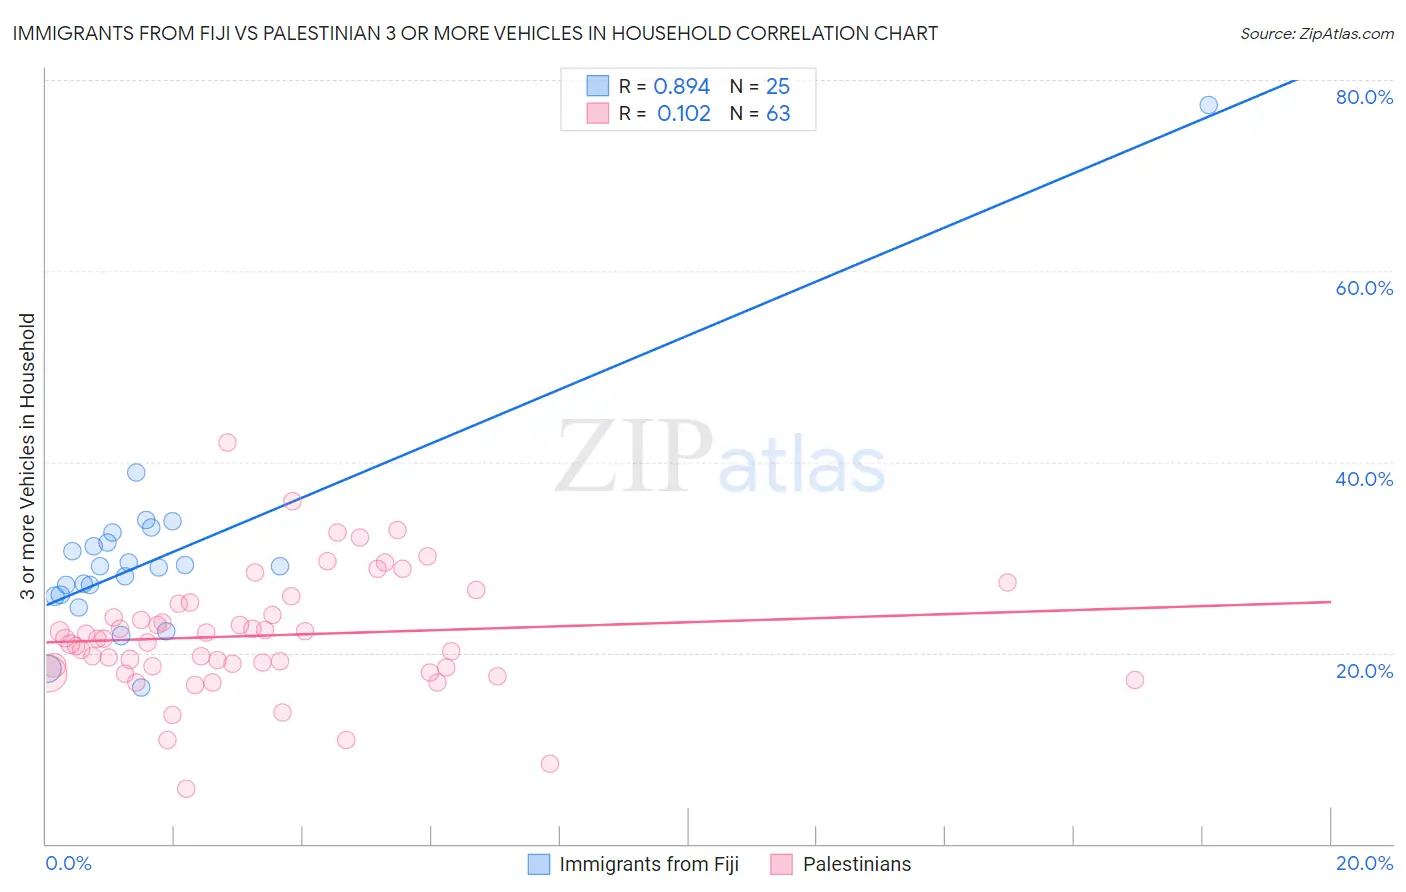
Immigrants from Fiji vs Palestinian 3 or more Vehicles in Household Correlation Chart
The statistical analysis conducted on geographies consisting of 93,749,578 people shows a very strong positive correlation between the proportion of Immigrants from Fiji and percentage of households with 3 or more vehicles available in the United States with a correlation coefficient (R) of 0.894 and weighted average of 26.1%. Similarly, the statistical analysis conducted on geographies consisting of 216,328,479 people shows a poor positive correlation between the proportion of Palestinians and percentage of households with 3 or more vehicles available in the United States with a correlation coefficient (R) of 0.102 and weighted average of 20.1%, a difference of 29.6%.
3 or more Vehicles in Household Correlation Summary
| Measurement | Immigrants from Fiji | Palestinian |
| Minimum | 16.4% | 5.8% |
| Maximum | 77.3% | 42.0% |
| Range | 60.9% | 36.2% |
| Mean | 30.1% | 21.8% |
| Median | 29.0% | 21.5% |
| Interquartile 25% (IQ1) | 26.0% | 18.5% |
| Interquartile 75% (IQ3) | 32.1% | 25.2% |
| Interquartile Range (IQR) | 6.1% | 6.7% |
| Standard Deviation (Sample) | 11.0% | 6.3% |
| Standard Deviation (Population) | 10.8% | 6.3% |
Similar Demographics by 3 or more Vehicles in Household
Demographics Similar to Immigrants from Fiji by 3 or more Vehicles in Household
In terms of 3 or more vehicles in household, the demographic groups most similar to Immigrants from Fiji are Colville (25.8%, a difference of 1.1%), Puget Sound Salish (26.4%, a difference of 1.2%), Arapaho (26.4%, a difference of 1.5%), Tongan (26.5%, a difference of 1.8%), and Spanish American Indian (26.9%, a difference of 3.4%).
| Demographics | Rating | Rank | 3 or more Vehicles in Household |
| Yakama | 100.0 /100 | #1 | Exceptional 31.0% |
| Spanish American Indians | 100.0 /100 | #2 | Exceptional 26.9% |
| Tongans | 100.0 /100 | #3 | Exceptional 26.5% |
| Arapaho | 100.0 /100 | #4 | Exceptional 26.4% |
| Puget Sound Salish | 100.0 /100 | #5 | Exceptional 26.4% |
| Immigrants | Fiji | 100.0 /100 | #6 | Exceptional 26.1% |
| Colville | 100.0 /100 | #7 | Exceptional 25.8% |
| Samoans | 100.0 /100 | #8 | Exceptional 25.0% |
| Native Hawaiians | 100.0 /100 | #9 | Exceptional 24.9% |
| Nepalese | 100.0 /100 | #10 | Exceptional 24.9% |
| Shoshone | 100.0 /100 | #11 | Exceptional 24.9% |
| Danes | 100.0 /100 | #12 | Exceptional 24.7% |
| Mexicans | 100.0 /100 | #13 | Exceptional 24.7% |
| Immigrants | Mexico | 100.0 /100 | #14 | Exceptional 24.6% |
| Hawaiians | 100.0 /100 | #15 | Exceptional 24.3% |
Demographics Similar to Palestinians by 3 or more Vehicles in Household
In terms of 3 or more vehicles in household, the demographic groups most similar to Palestinians are Iranian (20.1%, a difference of 0.010%), Australian (20.1%, a difference of 0.040%), Lithuanian (20.1%, a difference of 0.060%), Jordanian (20.1%, a difference of 0.070%), and Slovak (20.1%, a difference of 0.12%).
| Demographics | Rating | Rank | 3 or more Vehicles in Household |
| Aleuts | 86.3 /100 | #138 | Excellent 20.2% |
| Slovenes | 85.5 /100 | #139 | Excellent 20.2% |
| French American Indians | 85.3 /100 | #140 | Excellent 20.1% |
| Ottawa | 84.9 /100 | #141 | Excellent 20.1% |
| Jordanians | 84.4 /100 | #142 | Excellent 20.1% |
| Lithuanians | 84.4 /100 | #143 | Excellent 20.1% |
| Iranians | 84.0 /100 | #144 | Excellent 20.1% |
| Palestinians | 83.9 /100 | #145 | Excellent 20.1% |
| Australians | 83.6 /100 | #146 | Excellent 20.1% |
| Slovaks | 83.0 /100 | #147 | Excellent 20.1% |
| Guatemalans | 82.6 /100 | #148 | Excellent 20.1% |
| Immigrants | Iran | 80.9 /100 | #149 | Excellent 20.0% |
| Immigrants | Immigrants | 80.8 /100 | #150 | Excellent 20.0% |
| Taiwanese | 80.6 /100 | #151 | Excellent 20.0% |
| Lebanese | 79.8 /100 | #152 | Good 20.0% |