Immigrants from Fiji vs Immigrants from Colombia 3 or more Vehicles in Household
COMPARE
Immigrants from Fiji
Immigrants from Colombia
3 or more Vehicles in Household
3 or more Vehicles in Household Comparison
Immigrants from Fiji
Immigrants from Colombia
26.1%
3 OR MORE VEHICLES IN HOUSEHOLD
100.0/ 100
METRIC RATING
6th/ 347
METRIC RANK
17.3%
3 OR MORE VEHICLES IN HOUSEHOLD
0.3/ 100
METRIC RATING
284th/ 347
METRIC RANK
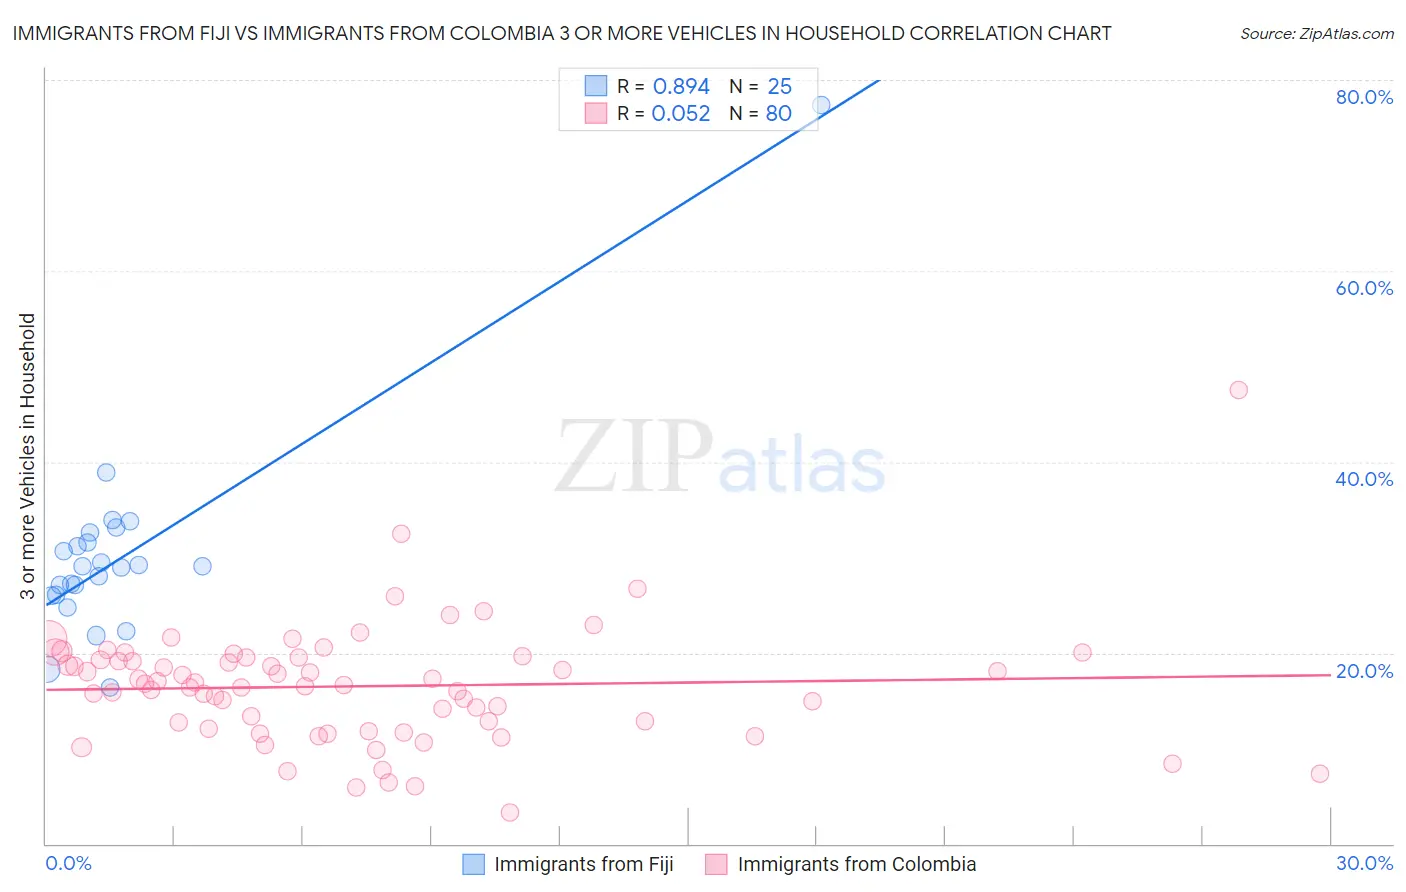
Immigrants from Fiji vs Immigrants from Colombia 3 or more Vehicles in Household Correlation Chart
The statistical analysis conducted on geographies consisting of 93,749,578 people shows a very strong positive correlation between the proportion of Immigrants from Fiji and percentage of households with 3 or more vehicles available in the United States with a correlation coefficient (R) of 0.894 and weighted average of 26.1%. Similarly, the statistical analysis conducted on geographies consisting of 378,439,541 people shows a slight positive correlation between the proportion of Immigrants from Colombia and percentage of households with 3 or more vehicles available in the United States with a correlation coefficient (R) of 0.052 and weighted average of 17.3%, a difference of 50.5%.
3 or more Vehicles in Household Correlation Summary
| Measurement | Immigrants from Fiji | Immigrants from Colombia |
| Minimum | 16.4% | 3.3% |
| Maximum | 77.3% | 47.5% |
| Range | 60.9% | 44.2% |
| Mean | 30.1% | 16.5% |
| Median | 29.0% | 16.7% |
| Interquartile 25% (IQ1) | 26.0% | 12.4% |
| Interquartile 75% (IQ3) | 32.1% | 19.5% |
| Interquartile Range (IQR) | 6.1% | 7.1% |
| Standard Deviation (Sample) | 11.0% | 6.3% |
| Standard Deviation (Population) | 10.8% | 6.2% |
Similar Demographics by 3 or more Vehicles in Household
Demographics Similar to Immigrants from Fiji by 3 or more Vehicles in Household
In terms of 3 or more vehicles in household, the demographic groups most similar to Immigrants from Fiji are Colville (25.8%, a difference of 1.1%), Puget Sound Salish (26.4%, a difference of 1.2%), Arapaho (26.4%, a difference of 1.5%), Tongan (26.5%, a difference of 1.8%), and Spanish American Indian (26.9%, a difference of 3.4%).
| Demographics | Rating | Rank | 3 or more Vehicles in Household |
| Yakama | 100.0 /100 | #1 | Exceptional 31.0% |
| Spanish American Indians | 100.0 /100 | #2 | Exceptional 26.9% |
| Tongans | 100.0 /100 | #3 | Exceptional 26.5% |
| Arapaho | 100.0 /100 | #4 | Exceptional 26.4% |
| Puget Sound Salish | 100.0 /100 | #5 | Exceptional 26.4% |
| Immigrants | Fiji | 100.0 /100 | #6 | Exceptional 26.1% |
| Colville | 100.0 /100 | #7 | Exceptional 25.8% |
| Samoans | 100.0 /100 | #8 | Exceptional 25.0% |
| Native Hawaiians | 100.0 /100 | #9 | Exceptional 24.9% |
| Nepalese | 100.0 /100 | #10 | Exceptional 24.9% |
| Shoshone | 100.0 /100 | #11 | Exceptional 24.9% |
| Danes | 100.0 /100 | #12 | Exceptional 24.7% |
| Mexicans | 100.0 /100 | #13 | Exceptional 24.7% |
| Immigrants | Mexico | 100.0 /100 | #14 | Exceptional 24.6% |
| Hawaiians | 100.0 /100 | #15 | Exceptional 24.3% |
Demographics Similar to Immigrants from Colombia by 3 or more Vehicles in Household
In terms of 3 or more vehicles in household, the demographic groups most similar to Immigrants from Colombia are Black/African American (17.3%, a difference of 0.12%), Immigrants from Ireland (17.3%, a difference of 0.17%), Immigrants from Latvia (17.4%, a difference of 0.46%), Immigrants from Eastern Europe (17.4%, a difference of 0.50%), and Immigrants from Kazakhstan (17.4%, a difference of 0.54%).
| Demographics | Rating | Rank | 3 or more Vehicles in Household |
| Brazilians | 0.4 /100 | #277 | Tragic 17.4% |
| Immigrants | Bahamas | 0.3 /100 | #278 | Tragic 17.4% |
| Immigrants | Kazakhstan | 0.3 /100 | #279 | Tragic 17.4% |
| Immigrants | Eastern Europe | 0.3 /100 | #280 | Tragic 17.4% |
| Immigrants | Latvia | 0.3 /100 | #281 | Tragic 17.4% |
| Immigrants | Ireland | 0.3 /100 | #282 | Tragic 17.3% |
| Blacks/African Americans | 0.3 /100 | #283 | Tragic 17.3% |
| Immigrants | Colombia | 0.3 /100 | #284 | Tragic 17.3% |
| Immigrants | Croatia | 0.2 /100 | #285 | Tragic 17.2% |
| Menominee | 0.2 /100 | #286 | Tragic 17.2% |
| Immigrants | Brazil | 0.2 /100 | #287 | Tragic 17.1% |
| Immigrants | Uruguay | 0.2 /100 | #288 | Tragic 17.1% |
| Immigrants | Liberia | 0.1 /100 | #289 | Tragic 17.1% |
| Liberians | 0.1 /100 | #290 | Tragic 17.0% |
| Immigrants | Congo | 0.1 /100 | #291 | Tragic 17.0% |