Immigrants from Fiji vs Italian 3 or more Vehicles in Household
COMPARE
Immigrants from Fiji
Italian
3 or more Vehicles in Household
3 or more Vehicles in Household Comparison
Immigrants from Fiji
Italians
26.1%
3 OR MORE VEHICLES IN HOUSEHOLD
100.0/ 100
METRIC RATING
6th/ 347
METRIC RANK
20.6%
3 OR MORE VEHICLES IN HOUSEHOLD
94.9/ 100
METRIC RATING
116th/ 347
METRIC RANK
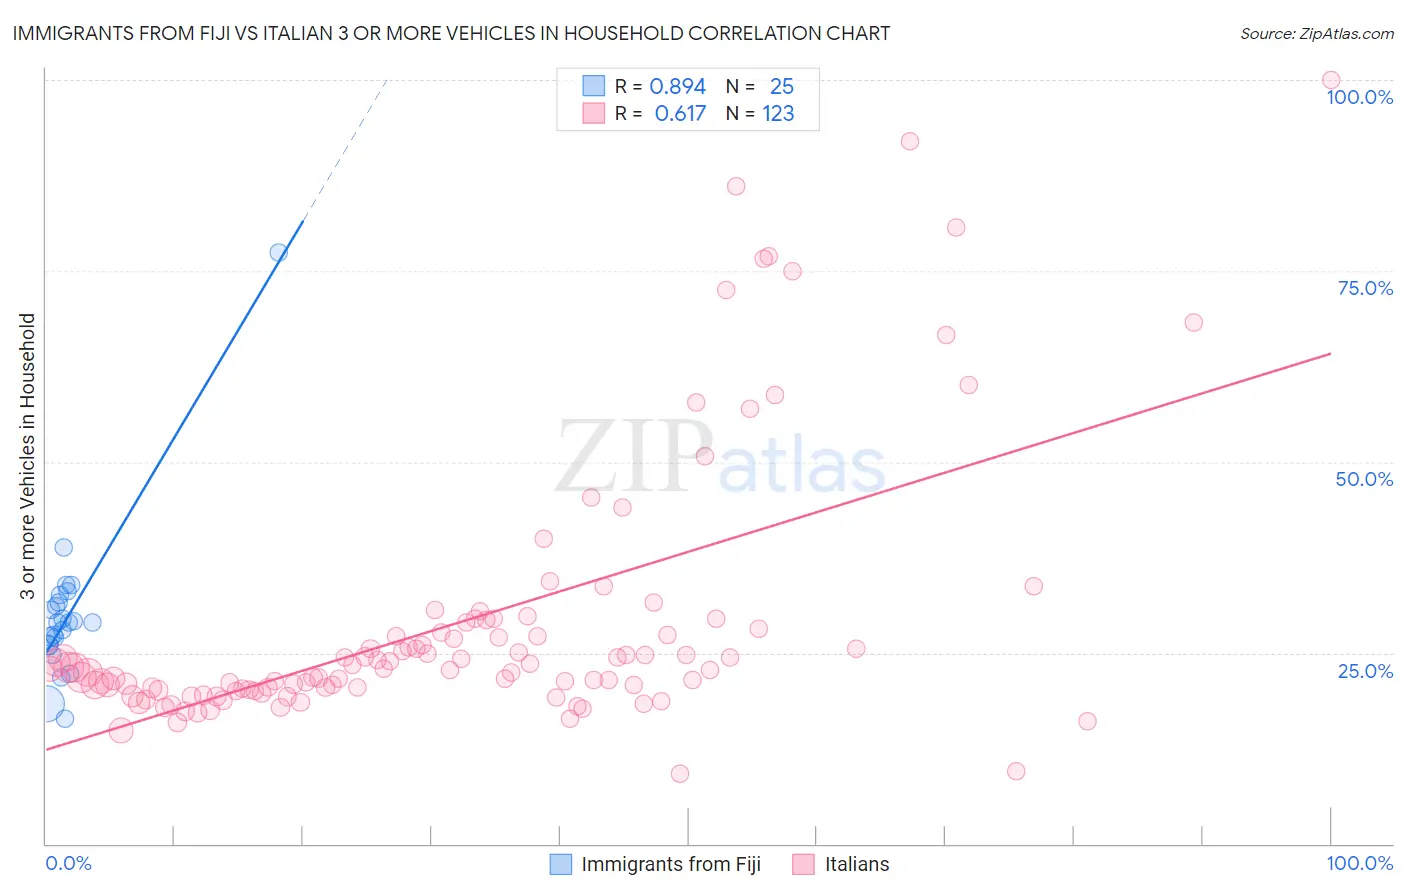
Immigrants from Fiji vs Italian 3 or more Vehicles in Household Correlation Chart
The statistical analysis conducted on geographies consisting of 93,749,578 people shows a very strong positive correlation between the proportion of Immigrants from Fiji and percentage of households with 3 or more vehicles available in the United States with a correlation coefficient (R) of 0.894 and weighted average of 26.1%. Similarly, the statistical analysis conducted on geographies consisting of 574,109,348 people shows a significant positive correlation between the proportion of Italians and percentage of households with 3 or more vehicles available in the United States with a correlation coefficient (R) of 0.617 and weighted average of 20.6%, a difference of 26.6%.
3 or more Vehicles in Household Correlation Summary
| Measurement | Immigrants from Fiji | Italian |
| Minimum | 16.4% | 9.2% |
| Maximum | 77.3% | 100.0% |
| Range | 60.9% | 90.8% |
| Mean | 30.1% | 29.1% |
| Median | 29.0% | 23.0% |
| Interquartile 25% (IQ1) | 26.0% | 20.2% |
| Interquartile 75% (IQ3) | 32.1% | 28.2% |
| Interquartile Range (IQR) | 6.1% | 8.1% |
| Standard Deviation (Sample) | 11.0% | 17.5% |
| Standard Deviation (Population) | 10.8% | 17.5% |
Similar Demographics by 3 or more Vehicles in Household
Demographics Similar to Immigrants from Fiji by 3 or more Vehicles in Household
In terms of 3 or more vehicles in household, the demographic groups most similar to Immigrants from Fiji are Colville (25.8%, a difference of 1.1%), Puget Sound Salish (26.4%, a difference of 1.2%), Arapaho (26.4%, a difference of 1.5%), Tongan (26.5%, a difference of 1.8%), and Spanish American Indian (26.9%, a difference of 3.4%).
| Demographics | Rating | Rank | 3 or more Vehicles in Household |
| Yakama | 100.0 /100 | #1 | Exceptional 31.0% |
| Spanish American Indians | 100.0 /100 | #2 | Exceptional 26.9% |
| Tongans | 100.0 /100 | #3 | Exceptional 26.5% |
| Arapaho | 100.0 /100 | #4 | Exceptional 26.4% |
| Puget Sound Salish | 100.0 /100 | #5 | Exceptional 26.4% |
| Immigrants | Fiji | 100.0 /100 | #6 | Exceptional 26.1% |
| Colville | 100.0 /100 | #7 | Exceptional 25.8% |
| Samoans | 100.0 /100 | #8 | Exceptional 25.0% |
| Native Hawaiians | 100.0 /100 | #9 | Exceptional 24.9% |
| Nepalese | 100.0 /100 | #10 | Exceptional 24.9% |
| Shoshone | 100.0 /100 | #11 | Exceptional 24.9% |
| Danes | 100.0 /100 | #12 | Exceptional 24.7% |
| Mexicans | 100.0 /100 | #13 | Exceptional 24.7% |
| Immigrants | Mexico | 100.0 /100 | #14 | Exceptional 24.6% |
| Hawaiians | 100.0 /100 | #15 | Exceptional 24.3% |
Demographics Similar to Italians by 3 or more Vehicles in Household
In terms of 3 or more vehicles in household, the demographic groups most similar to Italians are Croatian (20.6%, a difference of 0.020%), French Canadian (20.6%, a difference of 0.030%), Costa Rican (20.6%, a difference of 0.13%), Immigrants from Latin America (20.5%, a difference of 0.17%), and Burmese (20.6%, a difference of 0.34%).
| Demographics | Rating | Rank | 3 or more Vehicles in Household |
| Filipinos | 97.0 /100 | #109 | Exceptional 20.8% |
| Asians | 96.8 /100 | #110 | Exceptional 20.8% |
| Immigrants | Micronesia | 96.7 /100 | #111 | Exceptional 20.7% |
| Nicaraguans | 96.2 /100 | #112 | Exceptional 20.7% |
| Immigrants | England | 96.2 /100 | #113 | Exceptional 20.7% |
| Burmese | 95.8 /100 | #114 | Exceptional 20.6% |
| French Canadians | 95.0 /100 | #115 | Exceptional 20.6% |
| Italians | 94.9 /100 | #116 | Exceptional 20.6% |
| Croatians | 94.9 /100 | #117 | Exceptional 20.6% |
| Costa Ricans | 94.6 /100 | #118 | Exceptional 20.6% |
| Immigrants | Latin America | 94.5 /100 | #119 | Exceptional 20.5% |
| Maltese | 93.9 /100 | #120 | Exceptional 20.5% |
| Immigrants | Thailand | 93.8 /100 | #121 | Exceptional 20.5% |
| German Russians | 93.7 /100 | #122 | Exceptional 20.5% |
| Immigrants | Korea | 93.7 /100 | #123 | Exceptional 20.5% |