Immigrants from Europe vs Sri Lankan Female Poverty Among 18-24 Year Olds
COMPARE
Immigrants from Europe
Sri Lankan
Female Poverty Among 18-24 Year Olds
Female Poverty Among 18-24 Year Olds Comparison
Immigrants from Europe
Sri Lankans
18.8%
FEMALE POVERTY AMONG 18-24 YEAR OLDS
99.5/ 100
METRIC RATING
78th/ 347
METRIC RANK
18.2%
FEMALE POVERTY AMONG 18-24 YEAR OLDS
100.0/ 100
METRIC RATING
48th/ 347
METRIC RANK
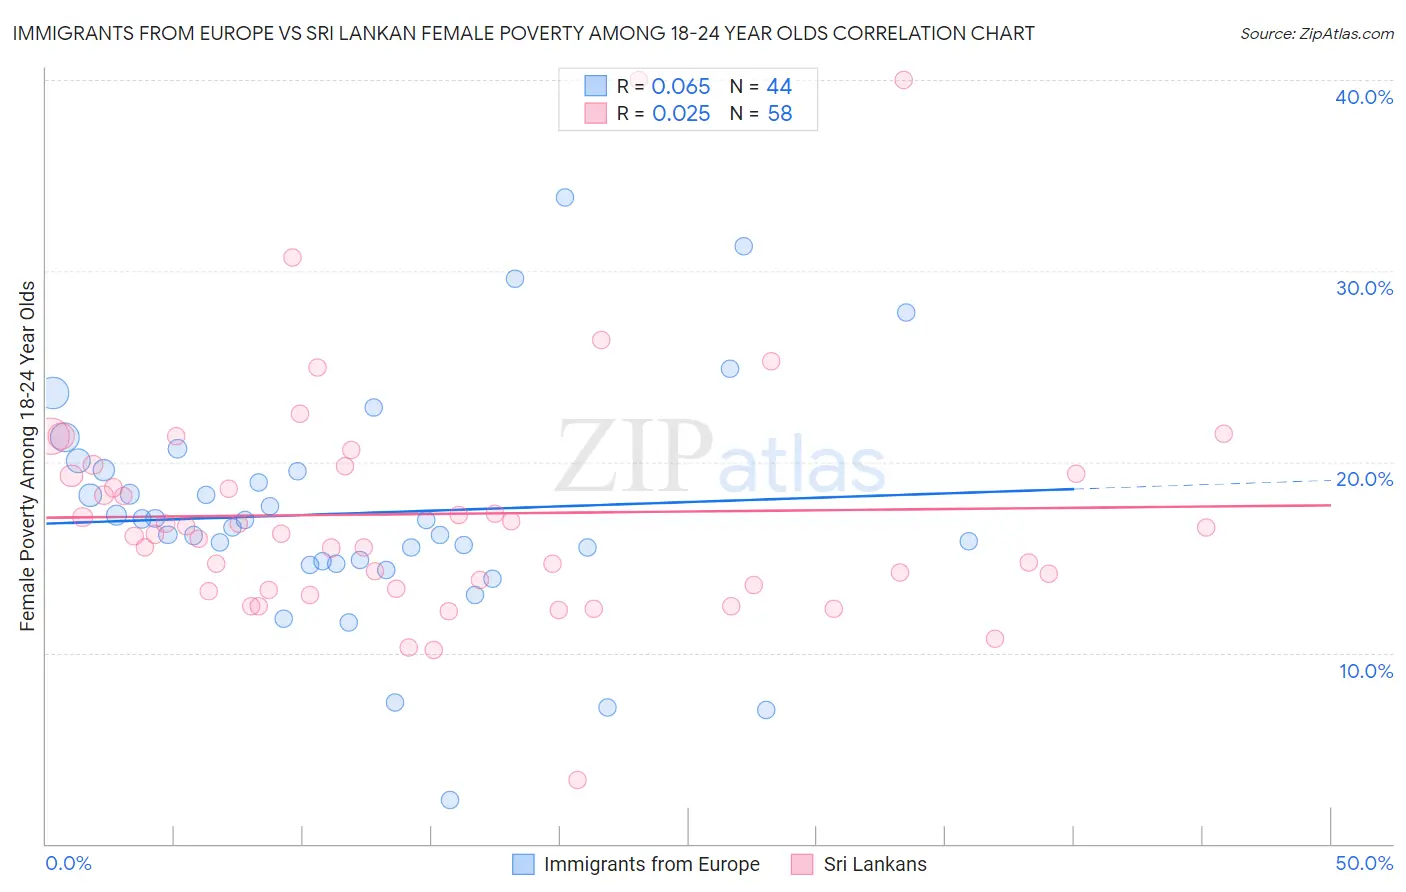
Immigrants from Europe vs Sri Lankan Female Poverty Among 18-24 Year Olds Correlation Chart
The statistical analysis conducted on geographies consisting of 519,189,287 people shows a slight positive correlation between the proportion of Immigrants from Europe and poverty level among females between the ages 18 and 24 in the United States with a correlation coefficient (R) of 0.065 and weighted average of 18.8%. Similarly, the statistical analysis conducted on geographies consisting of 429,284,128 people shows no correlation between the proportion of Sri Lankans and poverty level among females between the ages 18 and 24 in the United States with a correlation coefficient (R) of 0.025 and weighted average of 18.2%, a difference of 3.4%.
Female Poverty Among 18-24 Year Olds Correlation Summary
| Measurement | Immigrants from Europe | Sri Lankan |
| Minimum | 2.3% | 3.3% |
| Maximum | 33.9% | 40.0% |
| Range | 31.6% | 36.7% |
| Mean | 17.3% | 17.3% |
| Median | 16.8% | 16.2% |
| Interquartile 25% (IQ1) | 14.7% | 13.4% |
| Interquartile 75% (IQ3) | 19.5% | 19.3% |
| Interquartile Range (IQR) | 4.8% | 6.0% |
| Standard Deviation (Sample) | 6.1% | 6.2% |
| Standard Deviation (Population) | 6.0% | 6.2% |
Similar Demographics by Female Poverty Among 18-24 Year Olds
Demographics Similar to Immigrants from Europe by Female Poverty Among 18-24 Year Olds
In terms of female poverty among 18-24 year olds, the demographic groups most similar to Immigrants from Europe are Uruguayan (18.8%, a difference of 0.0%), Costa Rican (18.8%, a difference of 0.010%), Palestinian (18.8%, a difference of 0.080%), Japanese (18.8%, a difference of 0.080%), and Immigrants from Cambodia (18.8%, a difference of 0.11%).
| Demographics | Rating | Rank | Female Poverty Among 18-24 Year Olds |
| Immigrants | Haiti | 99.7 /100 | #71 | Exceptional 18.7% |
| Armenians | 99.7 /100 | #72 | Exceptional 18.7% |
| Lithuanians | 99.7 /100 | #73 | Exceptional 18.7% |
| Hawaiians | 99.6 /100 | #74 | Exceptional 18.7% |
| Poles | 99.6 /100 | #75 | Exceptional 18.8% |
| Immigrants | Cambodia | 99.5 /100 | #76 | Exceptional 18.8% |
| Costa Ricans | 99.5 /100 | #77 | Exceptional 18.8% |
| Immigrants | Europe | 99.5 /100 | #78 | Exceptional 18.8% |
| Uruguayans | 99.5 /100 | #79 | Exceptional 18.8% |
| Palestinians | 99.5 /100 | #80 | Exceptional 18.8% |
| Japanese | 99.5 /100 | #81 | Exceptional 18.8% |
| Immigrants | Uruguay | 99.4 /100 | #82 | Exceptional 18.8% |
| Immigrants | Indonesia | 99.4 /100 | #83 | Exceptional 18.9% |
| Burmese | 99.2 /100 | #84 | Exceptional 18.9% |
| Immigrants | Armenia | 99.2 /100 | #85 | Exceptional 18.9% |
Demographics Similar to Sri Lankans by Female Poverty Among 18-24 Year Olds
In terms of female poverty among 18-24 year olds, the demographic groups most similar to Sri Lankans are Bhutanese (18.2%, a difference of 0.030%), Asian (18.2%, a difference of 0.050%), Immigrants from Southern Europe (18.2%, a difference of 0.13%), Samoan (18.2%, a difference of 0.14%), and Immigrants from Eastern Europe (18.2%, a difference of 0.31%).
| Demographics | Rating | Rank | Female Poverty Among 18-24 Year Olds |
| Immigrants | Argentina | 100.0 /100 | #41 | Exceptional 18.0% |
| Bulgarians | 100.0 /100 | #42 | Exceptional 18.1% |
| Macedonians | 100.0 /100 | #43 | Exceptional 18.1% |
| Nicaraguans | 100.0 /100 | #44 | Exceptional 18.1% |
| Spanish American Indians | 100.0 /100 | #45 | Exceptional 18.1% |
| Immigrants | Southern Europe | 100.0 /100 | #46 | Exceptional 18.2% |
| Asians | 100.0 /100 | #47 | Exceptional 18.2% |
| Sri Lankans | 100.0 /100 | #48 | Exceptional 18.2% |
| Bhutanese | 100.0 /100 | #49 | Exceptional 18.2% |
| Samoans | 100.0 /100 | #50 | Exceptional 18.2% |
| Immigrants | Eastern Europe | 99.9 /100 | #51 | Exceptional 18.2% |
| Immigrants | Ireland | 99.9 /100 | #52 | Exceptional 18.3% |
| Italians | 99.9 /100 | #53 | Exceptional 18.3% |
| Immigrants | Egypt | 99.9 /100 | #54 | Exceptional 18.4% |
| Albanians | 99.9 /100 | #55 | Exceptional 18.4% |