Immigrants from Dominica vs Immigrants from Egypt No Vehicles in Household
COMPARE
Immigrants from Dominica
Immigrants from Egypt
No Vehicles in Household
No Vehicles in Household Comparison
Immigrants from Dominica
Immigrants from Egypt
22.2%
NO VEHICLES IN HOUSEHOLD
0.0/ 100
METRIC RATING
328th/ 347
METRIC RANK
12.2%
NO VEHICLES IN HOUSEHOLD
0.6/ 100
METRIC RATING
263rd/ 347
METRIC RANK
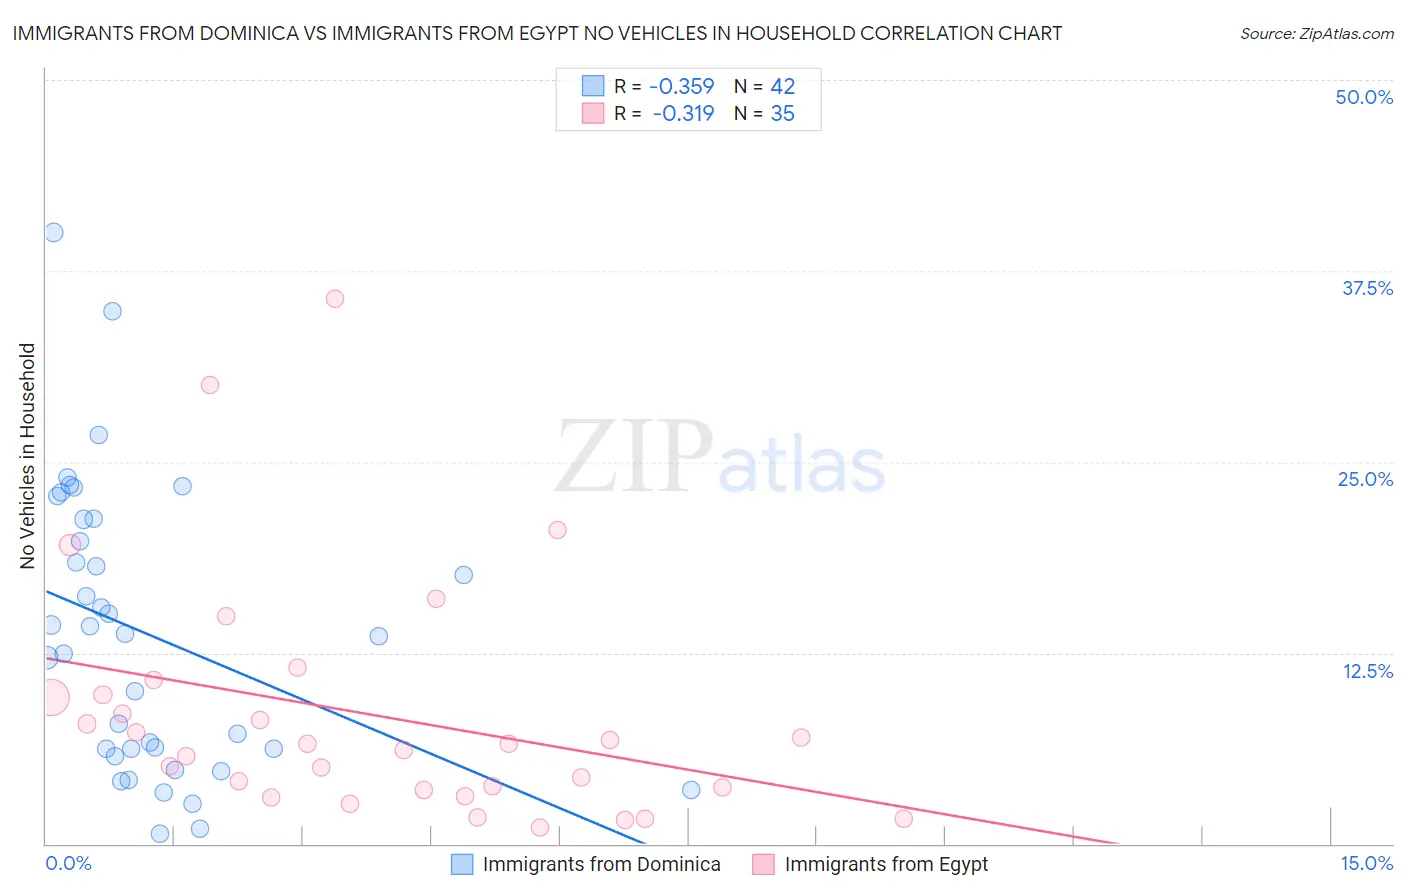
Immigrants from Dominica vs Immigrants from Egypt No Vehicles in Household Correlation Chart
The statistical analysis conducted on geographies consisting of 83,752,468 people shows a mild negative correlation between the proportion of Immigrants from Dominica and percentage of households with no vehicle available in the United States with a correlation coefficient (R) of -0.359 and weighted average of 22.2%. Similarly, the statistical analysis conducted on geographies consisting of 245,144,275 people shows a mild negative correlation between the proportion of Immigrants from Egypt and percentage of households with no vehicle available in the United States with a correlation coefficient (R) of -0.319 and weighted average of 12.2%, a difference of 81.8%.
No Vehicles in Household Correlation Summary
| Measurement | Immigrants from Dominica | Immigrants from Egypt |
| Minimum | 0.64% | 1.1% |
| Maximum | 40.0% | 35.7% |
| Range | 39.4% | 34.6% |
| Mean | 13.7% | 8.4% |
| Median | 13.7% | 6.5% |
| Interquartile 25% (IQ1) | 6.2% | 3.6% |
| Interquartile 75% (IQ3) | 21.2% | 9.7% |
| Interquartile Range (IQR) | 15.1% | 6.2% |
| Standard Deviation (Sample) | 9.3% | 7.8% |
| Standard Deviation (Population) | 9.2% | 7.7% |
Similar Demographics by No Vehicles in Household
Demographics Similar to Immigrants from Dominica by No Vehicles in Household
In terms of no vehicles in household, the demographic groups most similar to Immigrants from Dominica are Ecuadorian (22.8%, a difference of 2.3%), Immigrants from Senegal (21.1%, a difference of 5.1%), West Indian (23.7%, a difference of 6.6%), Trinidadian and Tobagonian (23.7%, a difference of 6.8%), and Immigrants from Ecuador (23.8%, a difference of 7.2%).
| Demographics | Rating | Rank | No Vehicles in Household |
| Jamaicans | 0.0 /100 | #321 | Tragic 17.9% |
| Immigrants | Cabo Verde | 0.0 /100 | #322 | Tragic 18.4% |
| Immigrants | Yemen | 0.0 /100 | #323 | Tragic 19.5% |
| Immigrants | Caribbean | 0.0 /100 | #324 | Tragic 19.6% |
| Senegalese | 0.0 /100 | #325 | Tragic 19.8% |
| Immigrants | West Indies | 0.0 /100 | #326 | Tragic 20.5% |
| Immigrants | Senegal | 0.0 /100 | #327 | Tragic 21.1% |
| Immigrants | Dominica | 0.0 /100 | #328 | Tragic 22.2% |
| Ecuadorians | 0.0 /100 | #329 | Tragic 22.8% |
| West Indians | 0.0 /100 | #330 | Tragic 23.7% |
| Trinidadians and Tobagonians | 0.0 /100 | #331 | Tragic 23.7% |
| Immigrants | Ecuador | 0.0 /100 | #332 | Tragic 23.8% |
| Immigrants | Trinidad and Tobago | 0.0 /100 | #333 | Tragic 24.6% |
| Immigrants | Bangladesh | 0.0 /100 | #334 | Tragic 25.8% |
| Barbadians | 0.0 /100 | #335 | Tragic 26.1% |
Demographics Similar to Immigrants from Egypt by No Vehicles in Household
In terms of no vehicles in household, the demographic groups most similar to Immigrants from Egypt are Immigrants from Liberia (12.2%, a difference of 0.15%), Subsaharan African (12.2%, a difference of 0.22%), Immigrants from Switzerland (12.3%, a difference of 0.46%), Macedonian (12.2%, a difference of 0.61%), and African (12.3%, a difference of 0.71%).
| Demographics | Rating | Rank | No Vehicles in Household |
| Liberians | 1.2 /100 | #256 | Tragic 12.0% |
| Nigerians | 0.9 /100 | #257 | Tragic 12.1% |
| South American Indians | 0.9 /100 | #258 | Tragic 12.1% |
| Immigrants | Latvia | 0.8 /100 | #259 | Tragic 12.1% |
| Macedonians | 0.7 /100 | #260 | Tragic 12.2% |
| Sub-Saharan Africans | 0.6 /100 | #261 | Tragic 12.2% |
| Immigrants | Liberia | 0.6 /100 | #262 | Tragic 12.2% |
| Immigrants | Egypt | 0.6 /100 | #263 | Tragic 12.2% |
| Immigrants | Switzerland | 0.5 /100 | #264 | Tragic 12.3% |
| Africans | 0.4 /100 | #265 | Tragic 12.3% |
| Israelis | 0.3 /100 | #266 | Tragic 12.4% |
| Immigrants | Europe | 0.3 /100 | #267 | Tragic 12.5% |
| Immigrants | Africa | 0.2 /100 | #268 | Tragic 12.5% |
| Panamanians | 0.2 /100 | #269 | Tragic 12.5% |
| Immigrants | Northern Africa | 0.2 /100 | #270 | Tragic 12.6% |