Immigrants from Dominica vs Turkish No Vehicles in Household
COMPARE
Immigrants from Dominica
Turkish
No Vehicles in Household
No Vehicles in Household Comparison
Immigrants from Dominica
Turks
22.2%
NO VEHICLES IN HOUSEHOLD
0.0/ 100
METRIC RATING
328th/ 347
METRIC RANK
11.7%
NO VEHICLES IN HOUSEHOLD
2.6/ 100
METRIC RATING
242nd/ 347
METRIC RANK
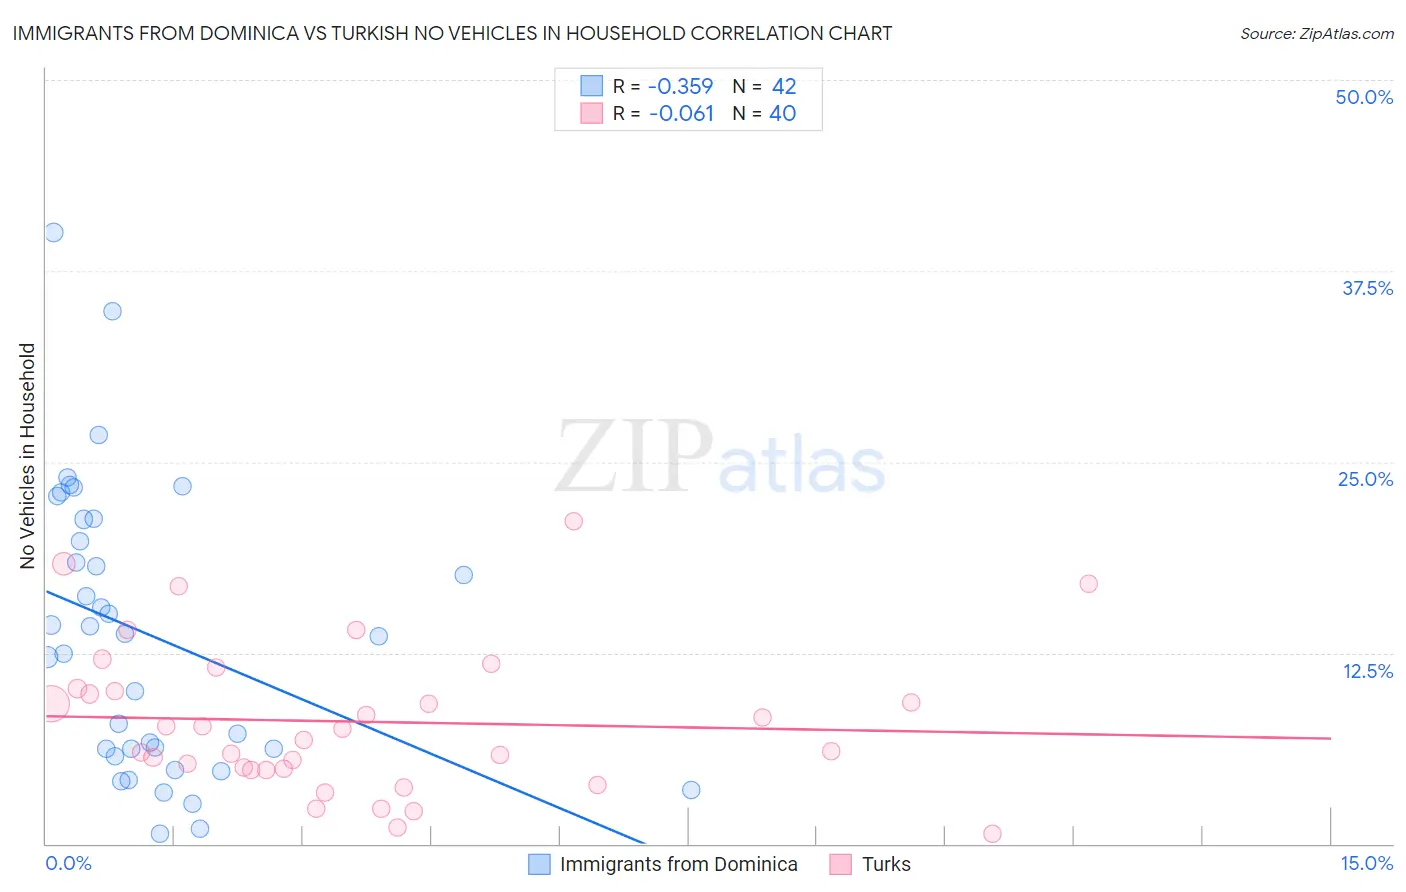
Immigrants from Dominica vs Turkish No Vehicles in Household Correlation Chart
The statistical analysis conducted on geographies consisting of 83,752,468 people shows a mild negative correlation between the proportion of Immigrants from Dominica and percentage of households with no vehicle available in the United States with a correlation coefficient (R) of -0.359 and weighted average of 22.2%. Similarly, the statistical analysis conducted on geographies consisting of 271,510,878 people shows a slight negative correlation between the proportion of Turks and percentage of households with no vehicle available in the United States with a correlation coefficient (R) of -0.061 and weighted average of 11.7%, a difference of 90.4%.
No Vehicles in Household Correlation Summary
| Measurement | Immigrants from Dominica | Turkish |
| Minimum | 0.64% | 0.69% |
| Maximum | 40.0% | 21.1% |
| Range | 39.4% | 20.4% |
| Mean | 13.7% | 8.0% |
| Median | 13.7% | 7.1% |
| Interquartile 25% (IQ1) | 6.2% | 4.9% |
| Interquartile 75% (IQ3) | 21.2% | 10.1% |
| Interquartile Range (IQR) | 15.1% | 5.2% |
| Standard Deviation (Sample) | 9.3% | 4.8% |
| Standard Deviation (Population) | 9.2% | 4.8% |
Similar Demographics by No Vehicles in Household
Demographics Similar to Immigrants from Dominica by No Vehicles in Household
In terms of no vehicles in household, the demographic groups most similar to Immigrants from Dominica are Ecuadorian (22.8%, a difference of 2.3%), Immigrants from Senegal (21.1%, a difference of 5.1%), West Indian (23.7%, a difference of 6.6%), Trinidadian and Tobagonian (23.7%, a difference of 6.8%), and Immigrants from Ecuador (23.8%, a difference of 7.2%).
| Demographics | Rating | Rank | No Vehicles in Household |
| Jamaicans | 0.0 /100 | #321 | Tragic 17.9% |
| Immigrants | Cabo Verde | 0.0 /100 | #322 | Tragic 18.4% |
| Immigrants | Yemen | 0.0 /100 | #323 | Tragic 19.5% |
| Immigrants | Caribbean | 0.0 /100 | #324 | Tragic 19.6% |
| Senegalese | 0.0 /100 | #325 | Tragic 19.8% |
| Immigrants | West Indies | 0.0 /100 | #326 | Tragic 20.5% |
| Immigrants | Senegal | 0.0 /100 | #327 | Tragic 21.1% |
| Immigrants | Dominica | 0.0 /100 | #328 | Tragic 22.2% |
| Ecuadorians | 0.0 /100 | #329 | Tragic 22.8% |
| West Indians | 0.0 /100 | #330 | Tragic 23.7% |
| Trinidadians and Tobagonians | 0.0 /100 | #331 | Tragic 23.7% |
| Immigrants | Ecuador | 0.0 /100 | #332 | Tragic 23.8% |
| Immigrants | Trinidad and Tobago | 0.0 /100 | #333 | Tragic 24.6% |
| Immigrants | Bangladesh | 0.0 /100 | #334 | Tragic 25.8% |
| Barbadians | 0.0 /100 | #335 | Tragic 26.1% |
Demographics Similar to Turks by No Vehicles in Household
In terms of no vehicles in household, the demographic groups most similar to Turks are Eastern European (11.7%, a difference of 0.11%), Immigrants (11.7%, a difference of 0.12%), Taiwanese (11.7%, a difference of 0.18%), Cheyenne (11.7%, a difference of 0.33%), and Immigrants from Portugal (11.7%, a difference of 0.51%).
| Demographics | Rating | Rank | No Vehicles in Household |
| Kiowa | 4.0 /100 | #235 | Tragic 11.5% |
| Cree | 3.5 /100 | #236 | Tragic 11.6% |
| Ute | 3.3 /100 | #237 | Tragic 11.6% |
| Russians | 3.2 /100 | #238 | Tragic 11.6% |
| Taiwanese | 2.8 /100 | #239 | Tragic 11.7% |
| Immigrants | Immigrants | 2.7 /100 | #240 | Tragic 11.7% |
| Eastern Europeans | 2.7 /100 | #241 | Tragic 11.7% |
| Turks | 2.6 /100 | #242 | Tragic 11.7% |
| Cheyenne | 2.4 /100 | #243 | Tragic 11.7% |
| Immigrants | Portugal | 2.2 /100 | #244 | Tragic 11.7% |
| Immigrants | Honduras | 2.1 /100 | #245 | Tragic 11.8% |
| Menominee | 2.0 /100 | #246 | Tragic 11.8% |
| Immigrants | Czechoslovakia | 2.0 /100 | #247 | Tragic 11.8% |
| Immigrants | Belgium | 1.9 /100 | #248 | Tragic 11.8% |
| Immigrants | Nigeria | 1.9 /100 | #249 | Tragic 11.8% |