Immigrants from Caribbean vs Immigrants from Kazakhstan 1 or more Vehicles in Household
COMPARE
Immigrants from Caribbean
Immigrants from Kazakhstan
1 or more Vehicles in Household
1 or more Vehicles in Household Comparison
Immigrants from Caribbean
Immigrants from Kazakhstan
80.4%
1 OR MORE VEHICLES IN HOUSEHOLD
0.0/ 100
METRIC RATING
324th/ 347
METRIC RANK
86.6%
1 OR MORE VEHICLES IN HOUSEHOLD
0.0/ 100
METRIC RATING
285th/ 347
METRIC RANK
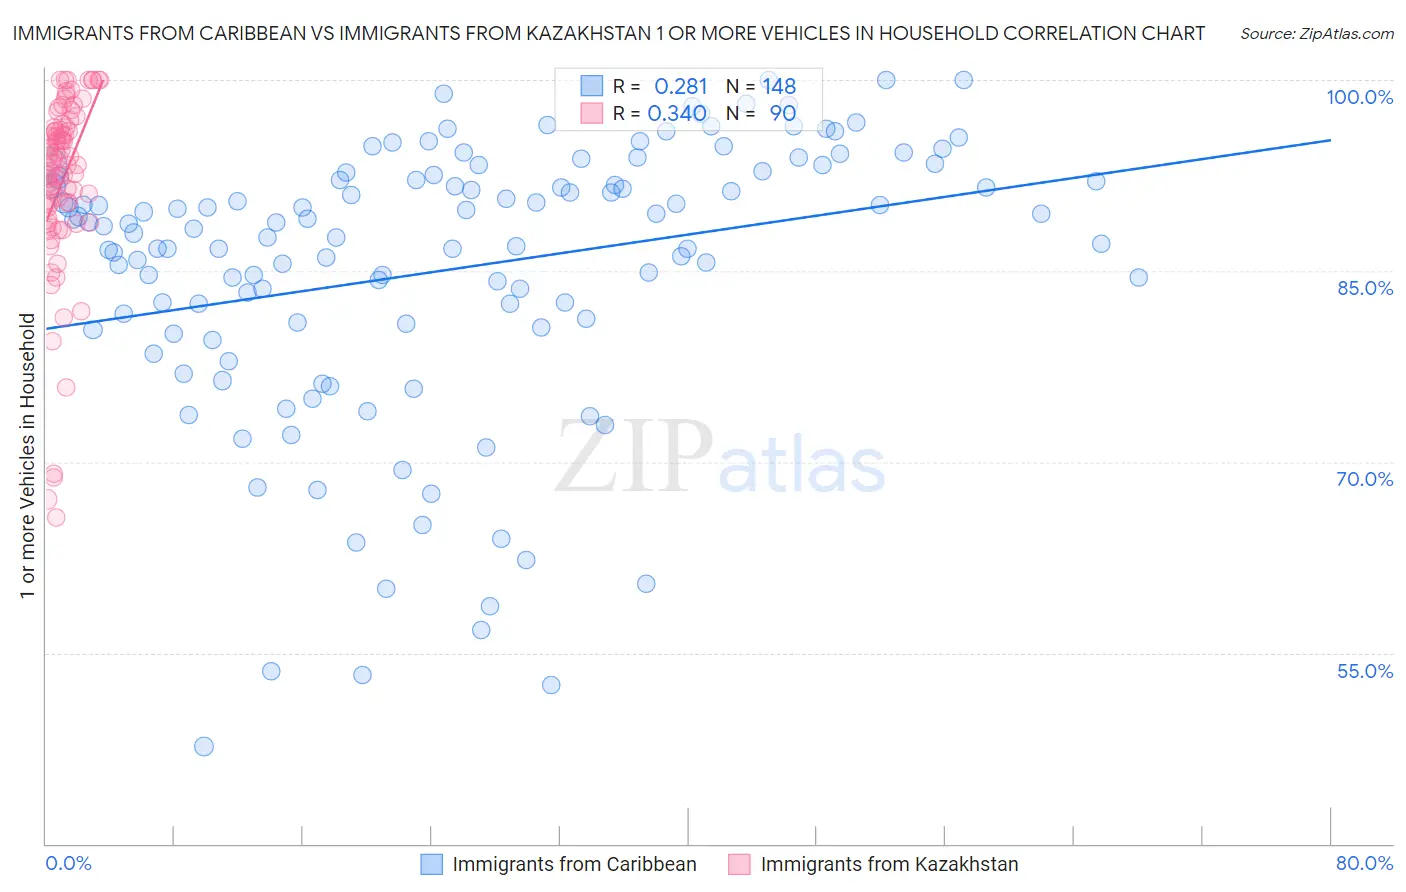
Immigrants from Caribbean vs Immigrants from Kazakhstan 1 or more Vehicles in Household Correlation Chart
The statistical analysis conducted on geographies consisting of 449,656,070 people shows a weak positive correlation between the proportion of Immigrants from Caribbean and percentage of households with 1 or more vehicles available in the United States with a correlation coefficient (R) of 0.281 and weighted average of 80.4%. Similarly, the statistical analysis conducted on geographies consisting of 124,327,848 people shows a mild positive correlation between the proportion of Immigrants from Kazakhstan and percentage of households with 1 or more vehicles available in the United States with a correlation coefficient (R) of 0.340 and weighted average of 86.6%, a difference of 7.6%.
1 or more Vehicles in Household Correlation Summary
| Measurement | Immigrants from Caribbean | Immigrants from Kazakhstan |
| Minimum | 47.7% | 65.6% |
| Maximum | 100.0% | 100.0% |
| Range | 52.3% | 34.4% |
| Mean | 85.1% | 92.0% |
| Median | 88.4% | 93.4% |
| Interquartile 25% (IQ1) | 80.9% | 90.0% |
| Interquartile 75% (IQ3) | 92.2% | 96.3% |
| Interquartile Range (IQR) | 11.3% | 6.2% |
| Standard Deviation (Sample) | 10.9% | 7.2% |
| Standard Deviation (Population) | 10.9% | 7.2% |
Similar Demographics by 1 or more Vehicles in Household
Demographics Similar to Immigrants from Caribbean by 1 or more Vehicles in Household
In terms of 1 or more vehicles in household, the demographic groups most similar to Immigrants from Caribbean are Senegalese (80.4%, a difference of 0.10%), Immigrants from Yemen (80.5%, a difference of 0.11%), Immigrants from West Indies (79.5%, a difference of 1.2%), Immigrants from Cabo Verde (81.6%, a difference of 1.4%), and Immigrants from Senegal (79.0%, a difference of 1.8%).
| Demographics | Rating | Rank | 1 or more Vehicles in Household |
| Ghanaians | 0.0 /100 | #317 | Tragic 83.6% |
| Immigrants | Ghana | 0.0 /100 | #318 | Tragic 83.4% |
| Immigrants | Belarus | 0.0 /100 | #319 | Tragic 83.3% |
| Soviet Union | 0.0 /100 | #320 | Tragic 82.7% |
| Jamaicans | 0.0 /100 | #321 | Tragic 82.1% |
| Immigrants | Cabo Verde | 0.0 /100 | #322 | Tragic 81.6% |
| Immigrants | Yemen | 0.0 /100 | #323 | Tragic 80.5% |
| Immigrants | Caribbean | 0.0 /100 | #324 | Tragic 80.4% |
| Senegalese | 0.0 /100 | #325 | Tragic 80.4% |
| Immigrants | West Indies | 0.0 /100 | #326 | Tragic 79.5% |
| Immigrants | Senegal | 0.0 /100 | #327 | Tragic 79.0% |
| Ecuadorians | 0.0 /100 | #328 | Tragic 77.9% |
| Immigrants | Dominica | 0.0 /100 | #329 | Tragic 77.8% |
| Immigrants | Trinidad and Tobago | 0.0 /100 | #330 | Tragic 76.8% |
| West Indians | 0.0 /100 | #331 | Tragic 76.4% |
Demographics Similar to Immigrants from Kazakhstan by 1 or more Vehicles in Household
In terms of 1 or more vehicles in household, the demographic groups most similar to Immigrants from Kazakhstan are Immigrants from Eastern Asia (86.5%, a difference of 0.030%), Immigrants from Malaysia (86.5%, a difference of 0.11%), Hopi (86.4%, a difference of 0.18%), Central American Indian (86.7%, a difference of 0.20%), and Immigrants from Ireland (86.4%, a difference of 0.20%).
| Demographics | Rating | Rank | 1 or more Vehicles in Household |
| Immigrants | Southern Europe | 0.1 /100 | #278 | Tragic 87.1% |
| Immigrants | Albania | 0.1 /100 | #279 | Tragic 87.1% |
| Immigrants | Croatia | 0.0 /100 | #280 | Tragic 87.0% |
| Mongolians | 0.0 /100 | #281 | Tragic 87.0% |
| Colville | 0.0 /100 | #282 | Tragic 86.8% |
| Immigrants | Eastern Europe | 0.0 /100 | #283 | Tragic 86.7% |
| Central American Indians | 0.0 /100 | #284 | Tragic 86.7% |
| Immigrants | Kazakhstan | 0.0 /100 | #285 | Tragic 86.6% |
| Immigrants | Eastern Asia | 0.0 /100 | #286 | Tragic 86.5% |
| Immigrants | Malaysia | 0.0 /100 | #287 | Tragic 86.5% |
| Hopi | 0.0 /100 | #288 | Tragic 86.4% |
| Immigrants | Ireland | 0.0 /100 | #289 | Tragic 86.4% |
| Immigrants | Australia | 0.0 /100 | #290 | Tragic 86.4% |
| Pima | 0.0 /100 | #291 | Tragic 86.3% |
| Okinawans | 0.0 /100 | #292 | Tragic 86.1% |