Immigrants from Czechoslovakia vs Immigrants from Kazakhstan Unemployment Among Women with Children Ages 6 to 17 years
COMPARE
Immigrants from Czechoslovakia
Immigrants from Kazakhstan
Unemployment Among Women with Children Ages 6 to 17 years
Unemployment Among Women with Children Ages 6 to 17 years Comparison
Immigrants from Czechoslovakia
Immigrants from Kazakhstan
9.0%
UNEMPLOYMENT AMONG WOMEN WITH CHILDREN AGES 6 TO 17 YEARS
34.5/ 100
METRIC RATING
181st/ 347
METRIC RANK
9.1%
UNEMPLOYMENT AMONG WOMEN WITH CHILDREN AGES 6 TO 17 YEARS
25.3/ 100
METRIC RATING
194th/ 347
METRIC RANK
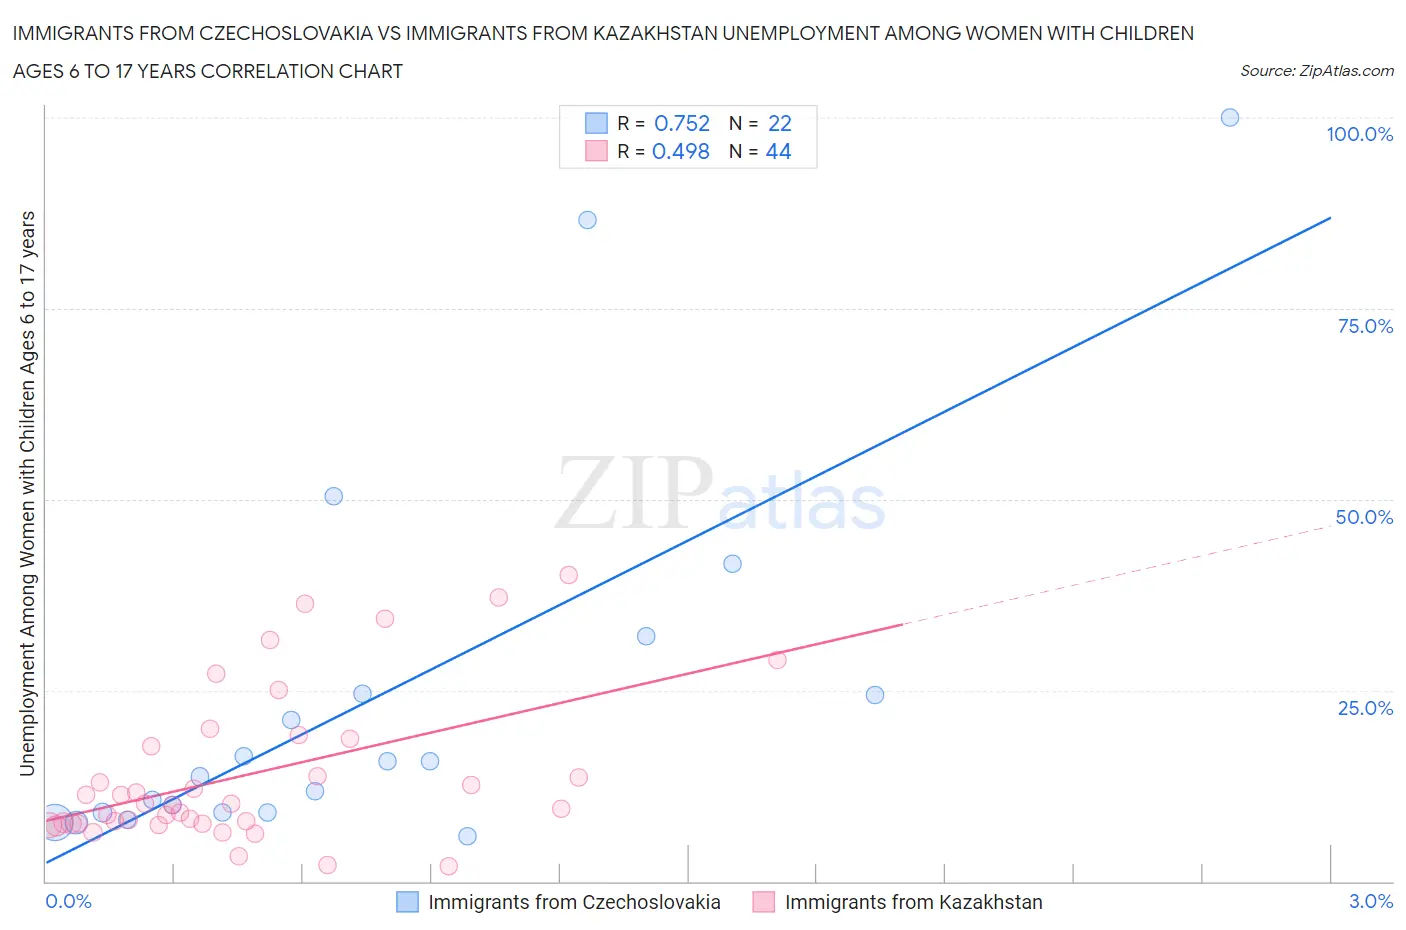
Immigrants from Czechoslovakia vs Immigrants from Kazakhstan Unemployment Among Women with Children Ages 6 to 17 years Correlation Chart
The statistical analysis conducted on geographies consisting of 154,961,774 people shows a strong positive correlation between the proportion of Immigrants from Czechoslovakia and unemployment rate among women with children between the ages 6 and 17 in the United States with a correlation coefficient (R) of 0.752 and weighted average of 9.0%. Similarly, the statistical analysis conducted on geographies consisting of 103,492,254 people shows a moderate positive correlation between the proportion of Immigrants from Kazakhstan and unemployment rate among women with children between the ages 6 and 17 in the United States with a correlation coefficient (R) of 0.498 and weighted average of 9.1%, a difference of 0.49%.
Unemployment Among Women with Children Ages 6 to 17 years Correlation Summary
| Measurement | Immigrants from Czechoslovakia | Immigrants from Kazakhstan |
| Minimum | 5.9% | 1.9% |
| Maximum | 100.0% | 40.1% |
| Range | 94.1% | 38.2% |
| Mean | 24.1% | 13.9% |
| Median | 14.7% | 10.0% |
| Interquartile 25% (IQ1) | 9.0% | 7.6% |
| Interquartile 75% (IQ3) | 24.6% | 18.1% |
| Interquartile Range (IQR) | 15.6% | 10.5% |
| Standard Deviation (Sample) | 25.3% | 10.0% |
| Standard Deviation (Population) | 24.7% | 9.8% |
Demographics Similar to Immigrants from Czechoslovakia and Immigrants from Kazakhstan by Unemployment Among Women with Children Ages 6 to 17 years
In terms of unemployment among women with children ages 6 to 17 years, the demographic groups most similar to Immigrants from Czechoslovakia are South American Indian (9.0%, a difference of 0.010%), Swiss (9.0%, a difference of 0.050%), Palestinian (9.0%, a difference of 0.050%), Immigrants from Congo (9.0%, a difference of 0.10%), and Immigrants from Spain (9.0%, a difference of 0.10%). Similarly, the demographic groups most similar to Immigrants from Kazakhstan are Austrian (9.1%, a difference of 0.020%), Immigrants from Turkey (9.1%, a difference of 0.030%), Brazilian (9.1%, a difference of 0.050%), Immigrants from Panama (9.1%, a difference of 0.060%), and Guamanian/Chamorro (9.1%, a difference of 0.11%).
| Demographics | Rating | Rank | Unemployment Among Women with Children Ages 6 to 17 years |
| Immigrants | Jordan | 41.6 /100 | #177 | Average 9.0% |
| Menominee | 39.3 /100 | #178 | Fair 9.0% |
| Immigrants | Zaire | 38.3 /100 | #179 | Fair 9.0% |
| Ethiopians | 37.6 /100 | #180 | Fair 9.0% |
| Immigrants | Czechoslovakia | 34.5 /100 | #181 | Fair 9.0% |
| South American Indians | 34.4 /100 | #182 | Fair 9.0% |
| Swiss | 33.5 /100 | #183 | Fair 9.0% |
| Palestinians | 33.4 /100 | #184 | Fair 9.0% |
| Immigrants | Congo | 32.5 /100 | #185 | Fair 9.0% |
| Immigrants | Spain | 32.4 /100 | #186 | Fair 9.0% |
| Comanche | 30.0 /100 | #187 | Fair 9.0% |
| Immigrants | Syria | 29.7 /100 | #188 | Fair 9.1% |
| Immigrants | Immigrants | 29.2 /100 | #189 | Fair 9.1% |
| Slovenes | 28.5 /100 | #190 | Fair 9.1% |
| Belizeans | 28.4 /100 | #191 | Fair 9.1% |
| Guamanians/Chamorros | 27.2 /100 | #192 | Fair 9.1% |
| Immigrants | Turkey | 25.8 /100 | #193 | Fair 9.1% |
| Immigrants | Kazakhstan | 25.3 /100 | #194 | Fair 9.1% |
| Austrians | 25.0 /100 | #195 | Fair 9.1% |
| Brazilians | 24.4 /100 | #196 | Fair 9.1% |
| Immigrants | Panama | 24.3 /100 | #197 | Fair 9.1% |