Immigrants from Cuba vs Okinawan 4 or more Vehicles in Household
COMPARE
Immigrants from Cuba
Okinawan
4 or more Vehicles in Household
4 or more Vehicles in Household Comparison
Immigrants from Cuba
Okinawans
5.7%
4 OR MORE VEHICLES IN HOUSEHOLD
1.6/ 100
METRIC RATING
253rd/ 347
METRIC RANK
5.5%
4 OR MORE VEHICLES IN HOUSEHOLD
0.6/ 100
METRIC RATING
270th/ 347
METRIC RANK
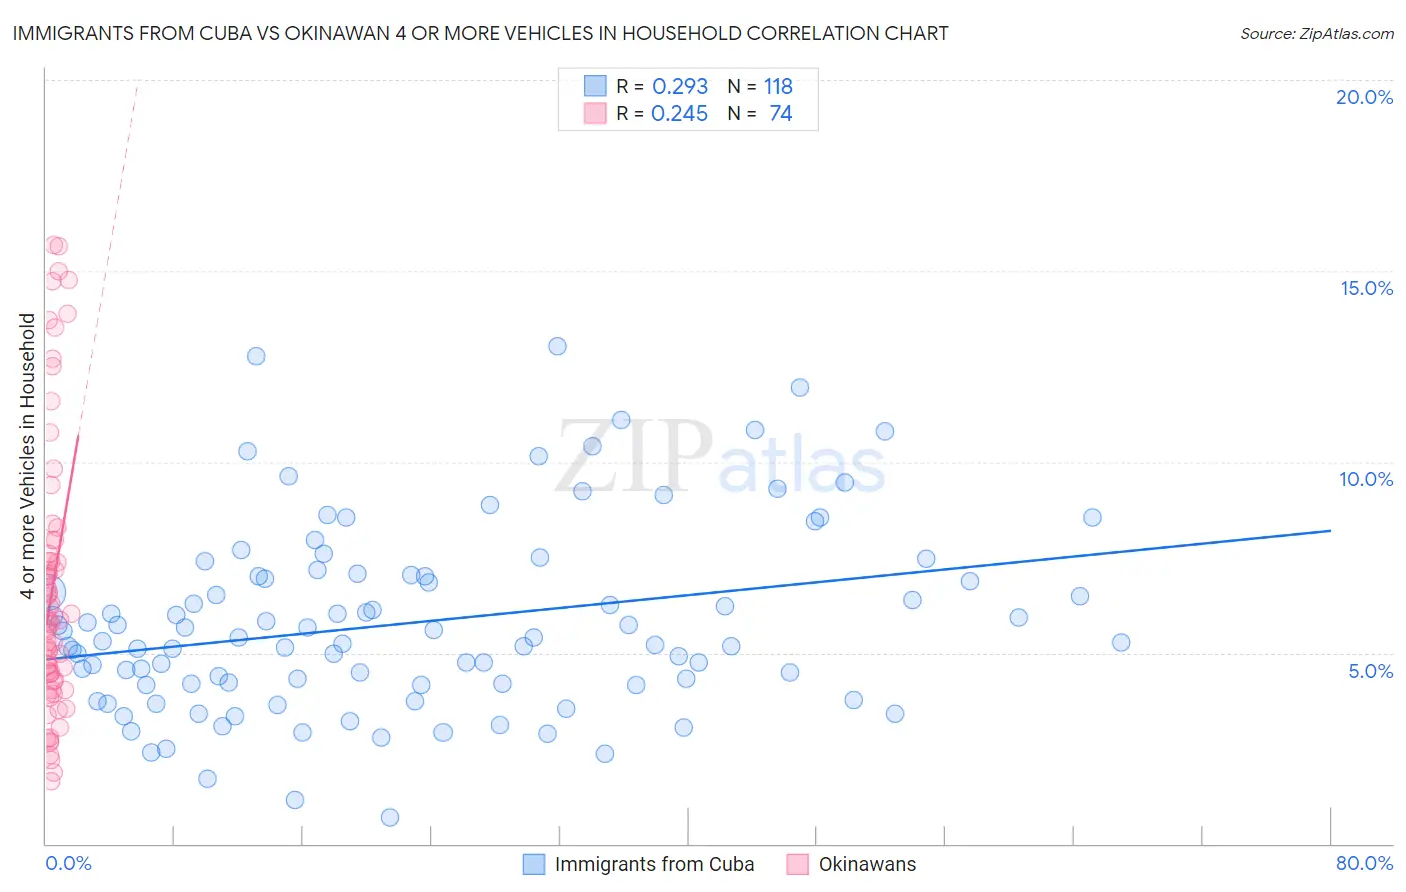
Immigrants from Cuba vs Okinawan 4 or more Vehicles in Household Correlation Chart
The statistical analysis conducted on geographies consisting of 324,547,642 people shows a weak positive correlation between the proportion of Immigrants from Cuba and percentage of households with 4 or more vehicles available in the United States with a correlation coefficient (R) of 0.293 and weighted average of 5.7%. Similarly, the statistical analysis conducted on geographies consisting of 73,384,410 people shows a weak positive correlation between the proportion of Okinawans and percentage of households with 4 or more vehicles available in the United States with a correlation coefficient (R) of 0.245 and weighted average of 5.5%, a difference of 2.7%.
4 or more Vehicles in Household Correlation Summary
| Measurement | Immigrants from Cuba | Okinawan |
| Minimum | 0.68% | 1.6% |
| Maximum | 13.0% | 15.7% |
| Range | 12.4% | 14.0% |
| Mean | 5.8% | 6.7% |
| Median | 5.4% | 5.8% |
| Interquartile 25% (IQ1) | 4.2% | 4.3% |
| Interquartile 75% (IQ3) | 7.0% | 7.6% |
| Interquartile Range (IQR) | 2.8% | 3.3% |
| Standard Deviation (Sample) | 2.4% | 3.6% |
| Standard Deviation (Population) | 2.4% | 3.6% |
Demographics Similar to Immigrants from Cuba and Okinawans by 4 or more Vehicles in Household
In terms of 4 or more vehicles in household, the demographic groups most similar to Immigrants from Cuba are Immigrants from Panama (5.7%, a difference of 0.14%), Yup'ik (5.7%, a difference of 0.22%), Immigrants from Turkey (5.7%, a difference of 0.26%), Immigrants from Northern Africa (5.6%, a difference of 0.34%), and Immigrants from Lithuania (5.6%, a difference of 0.48%). Similarly, the demographic groups most similar to Okinawans are Immigrants from Sudan (5.5%, a difference of 0.10%), Carpatho Rusyn (5.5%, a difference of 0.20%), Colombian (5.5%, a difference of 0.36%), Immigrants from Ukraine (5.6%, a difference of 0.79%), and Immigrants from Nepal (5.6%, a difference of 0.87%).
| Demographics | Rating | Rank | 4 or more Vehicles in Household |
| Ugandans | 2.2 /100 | #251 | Tragic 5.7% |
| Sub-Saharan Africans | 2.1 /100 | #252 | Tragic 5.7% |
| Immigrants | Cuba | 1.6 /100 | #253 | Tragic 5.7% |
| Immigrants | Panama | 1.5 /100 | #254 | Tragic 5.7% |
| Yup'ik | 1.5 /100 | #255 | Tragic 5.7% |
| Immigrants | Turkey | 1.5 /100 | #256 | Tragic 5.7% |
| Immigrants | Northern Africa | 1.4 /100 | #257 | Tragic 5.6% |
| Immigrants | Lithuania | 1.4 /100 | #258 | Tragic 5.6% |
| Immigrants | France | 1.3 /100 | #259 | Tragic 5.6% |
| Uruguayans | 1.3 /100 | #260 | Tragic 5.6% |
| Sudanese | 1.2 /100 | #261 | Tragic 5.6% |
| Bermudans | 1.2 /100 | #262 | Tragic 5.6% |
| Immigrants | Saudi Arabia | 1.1 /100 | #263 | Tragic 5.6% |
| Immigrants | Africa | 1.0 /100 | #264 | Tragic 5.6% |
| South Americans | 0.9 /100 | #265 | Tragic 5.6% |
| Immigrants | Nepal | 0.9 /100 | #266 | Tragic 5.6% |
| Immigrants | Ukraine | 0.9 /100 | #267 | Tragic 5.6% |
| Colombians | 0.7 /100 | #268 | Tragic 5.5% |
| Carpatho Rusyns | 0.7 /100 | #269 | Tragic 5.5% |
| Okinawans | 0.6 /100 | #270 | Tragic 5.5% |
| Immigrants | Sudan | 0.6 /100 | #271 | Tragic 5.5% |