Immigrants from Central America vs Israeli 2 or more Vehicles in Household
COMPARE
Immigrants from Central America
Israeli
2 or more Vehicles in Household
2 or more Vehicles in Household Comparison
Immigrants from Central America
Israelis
58.6%
2 OR MORE VEHICLES IN HOUSEHOLD
99.7/ 100
METRIC RATING
65th/ 347
METRIC RANK
51.9%
2 OR MORE VEHICLES IN HOUSEHOLD
0.2/ 100
METRIC RATING
273rd/ 347
METRIC RANK
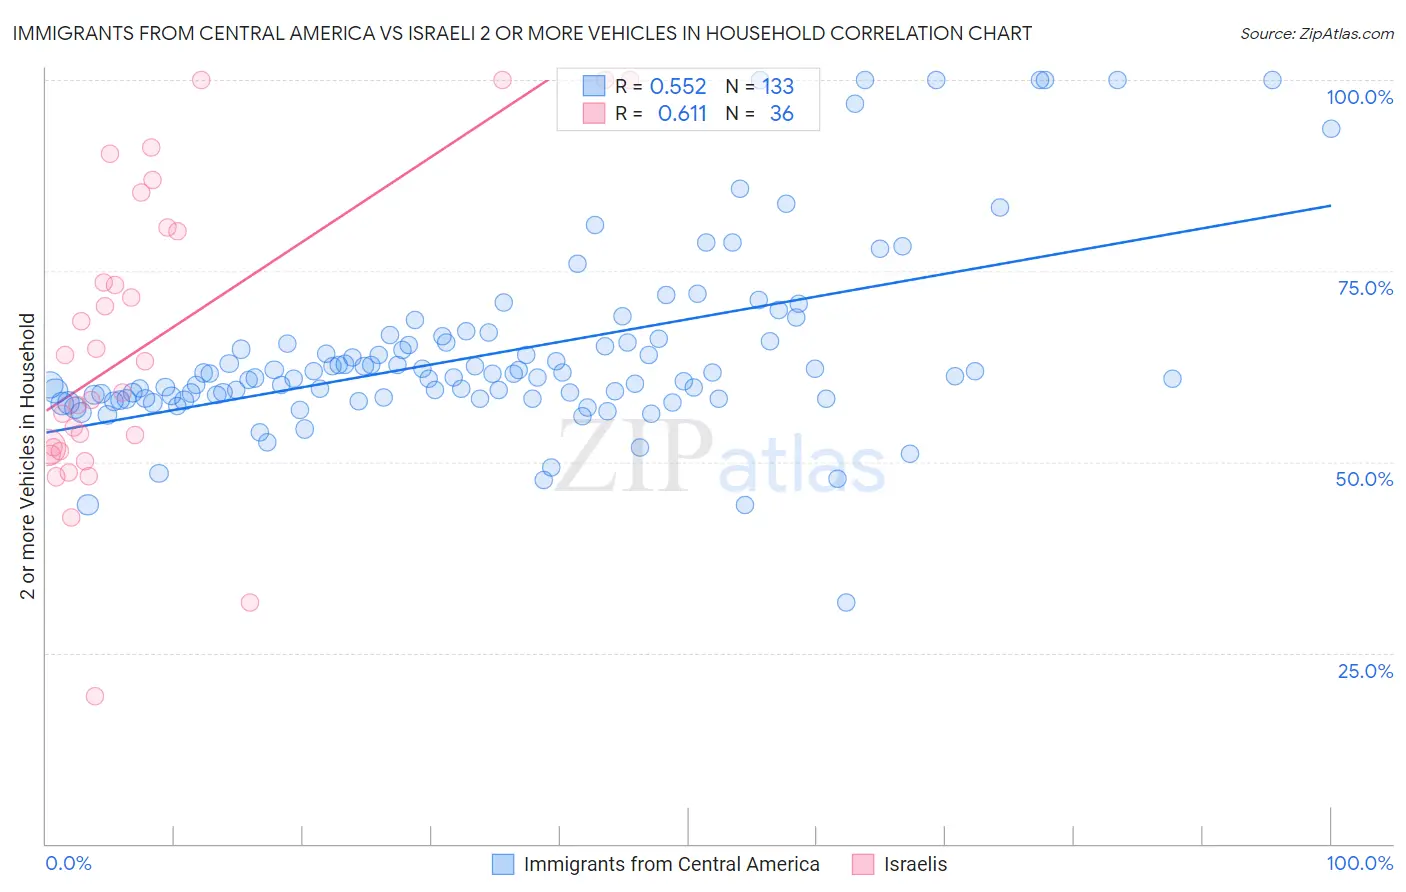
Immigrants from Central America vs Israeli 2 or more Vehicles in Household Correlation Chart
The statistical analysis conducted on geographies consisting of 536,122,766 people shows a substantial positive correlation between the proportion of Immigrants from Central America and percentage of households with 2 or more vehicles available in the United States with a correlation coefficient (R) of 0.552 and weighted average of 58.6%. Similarly, the statistical analysis conducted on geographies consisting of 211,040,574 people shows a significant positive correlation between the proportion of Israelis and percentage of households with 2 or more vehicles available in the United States with a correlation coefficient (R) of 0.611 and weighted average of 51.9%, a difference of 13.0%.
2 or more Vehicles in Household Correlation Summary
| Measurement | Immigrants from Central America | Israeli |
| Minimum | 31.6% | 19.3% |
| Maximum | 100.0% | 100.0% |
| Range | 68.4% | 80.7% |
| Mean | 64.2% | 65.3% |
| Median | 61.2% | 61.1% |
| Interquartile 25% (IQ1) | 58.3% | 51.6% |
| Interquartile 75% (IQ3) | 65.7% | 80.4% |
| Interquartile Range (IQR) | 7.4% | 28.8% |
| Standard Deviation (Sample) | 12.0% | 19.9% |
| Standard Deviation (Population) | 12.0% | 19.6% |
Similar Demographics by 2 or more Vehicles in Household
Demographics Similar to Immigrants from Central America by 2 or more Vehicles in Household
In terms of 2 or more vehicles in household, the demographic groups most similar to Immigrants from Central America are Croatian (58.6%, a difference of 0.010%), Laotian (58.6%, a difference of 0.020%), Canadian (58.6%, a difference of 0.040%), Portuguese (58.6%, a difference of 0.050%), and Pennsylvania German (58.5%, a difference of 0.16%).
| Demographics | Rating | Rank | 2 or more Vehicles in Household |
| Immigrants | Scotland | 99.8 /100 | #58 | Exceptional 58.9% |
| Spanish Americans | 99.8 /100 | #59 | Exceptional 58.9% |
| French Canadians | 99.8 /100 | #60 | Exceptional 58.9% |
| Osage | 99.8 /100 | #61 | Exceptional 58.8% |
| Immigrants | Nonimmigrants | 99.8 /100 | #62 | Exceptional 58.8% |
| Mexican American Indians | 99.8 /100 | #63 | Exceptional 58.7% |
| Portuguese | 99.7 /100 | #64 | Exceptional 58.6% |
| Immigrants | Central America | 99.7 /100 | #65 | Exceptional 58.6% |
| Croatians | 99.7 /100 | #66 | Exceptional 58.6% |
| Laotians | 99.7 /100 | #67 | Exceptional 58.6% |
| Canadians | 99.7 /100 | #68 | Exceptional 58.6% |
| Pennsylvania Germans | 99.7 /100 | #69 | Exceptional 58.5% |
| Italians | 99.6 /100 | #70 | Exceptional 58.4% |
| Bangladeshis | 99.6 /100 | #71 | Exceptional 58.4% |
| Austrians | 99.6 /100 | #72 | Exceptional 58.4% |
Demographics Similar to Israelis by 2 or more Vehicles in Household
In terms of 2 or more vehicles in household, the demographic groups most similar to Israelis are African (51.8%, a difference of 0.050%), Immigrants from Honduras (51.8%, a difference of 0.060%), Subsaharan African (51.9%, a difference of 0.090%), Immigrants from Croatia (51.8%, a difference of 0.090%), and South American (51.9%, a difference of 0.12%).
| Demographics | Rating | Rank | 2 or more Vehicles in Household |
| Immigrants | France | 0.2 /100 | #266 | Tragic 52.0% |
| Immigrants | Colombia | 0.2 /100 | #267 | Tragic 52.0% |
| Pima | 0.2 /100 | #268 | Tragic 52.0% |
| Hondurans | 0.2 /100 | #269 | Tragic 52.0% |
| Immigrants | Ireland | 0.2 /100 | #270 | Tragic 52.0% |
| South Americans | 0.2 /100 | #271 | Tragic 51.9% |
| Sub-Saharan Africans | 0.2 /100 | #272 | Tragic 51.9% |
| Israelis | 0.2 /100 | #273 | Tragic 51.9% |
| Africans | 0.2 /100 | #274 | Tragic 51.8% |
| Immigrants | Honduras | 0.2 /100 | #275 | Tragic 51.8% |
| Immigrants | Croatia | 0.2 /100 | #276 | Tragic 51.8% |
| Immigrants | Africa | 0.2 /100 | #277 | Tragic 51.8% |
| Yuman | 0.1 /100 | #278 | Tragic 51.7% |
| Liberians | 0.1 /100 | #279 | Tragic 51.7% |
| Immigrants | Eastern Europe | 0.1 /100 | #280 | Tragic 51.7% |