Immigrants from Caribbean vs Haitian No Vehicles in Household
COMPARE
Immigrants from Caribbean
Haitian
No Vehicles in Household
No Vehicles in Household Comparison
Immigrants from Caribbean
Haitians
19.6%
NO VEHICLES IN HOUSEHOLD
0.0/ 100
METRIC RATING
324th/ 347
METRIC RANK
14.9%
NO VEHICLES IN HOUSEHOLD
0.0/ 100
METRIC RATING
302nd/ 347
METRIC RANK
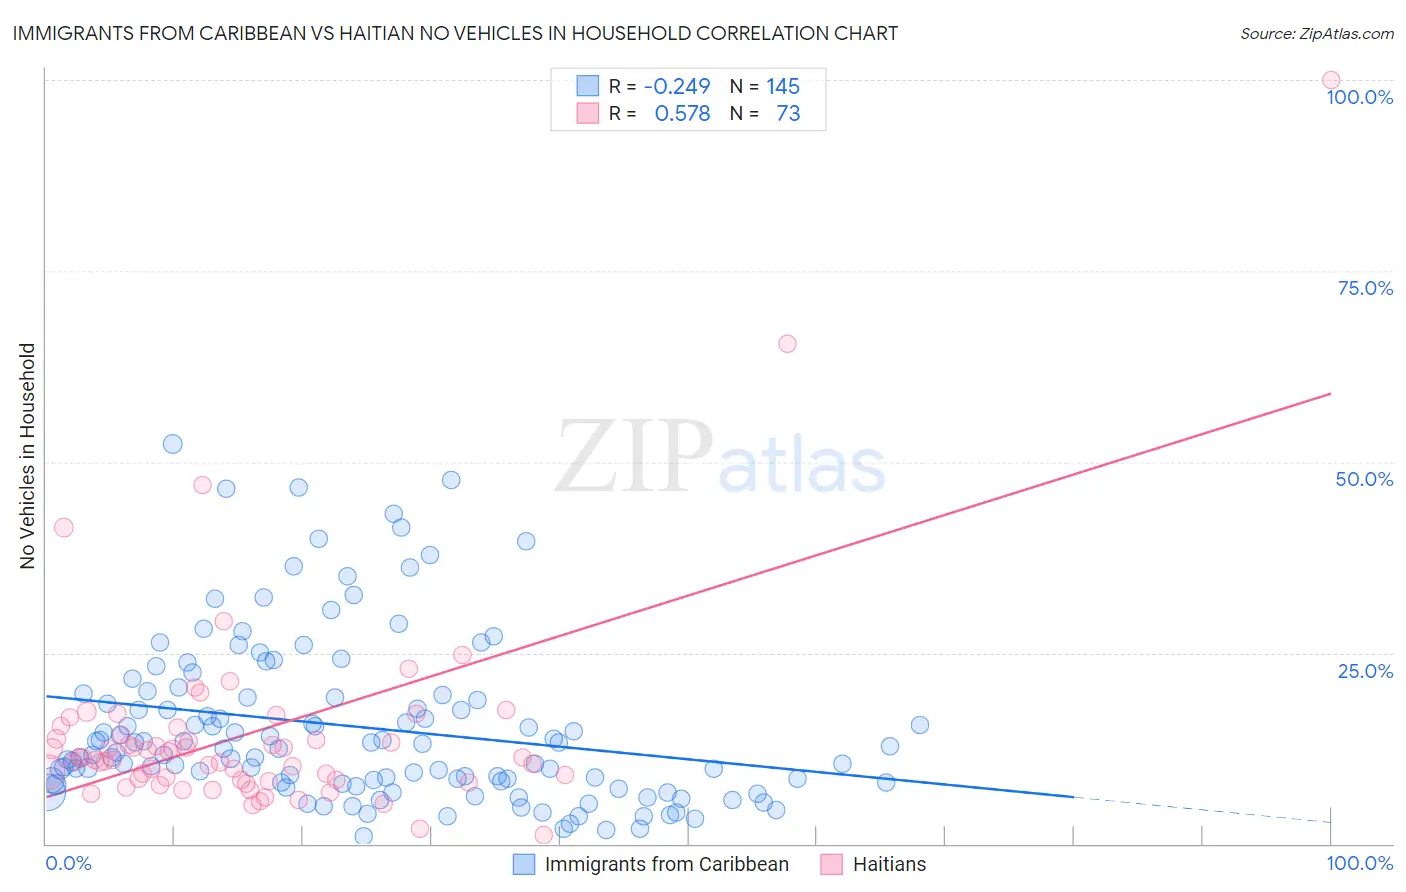
Immigrants from Caribbean vs Haitian No Vehicles in Household Correlation Chart
The statistical analysis conducted on geographies consisting of 448,573,126 people shows a weak negative correlation between the proportion of Immigrants from Caribbean and percentage of households with no vehicle available in the United States with a correlation coefficient (R) of -0.249 and weighted average of 19.6%. Similarly, the statistical analysis conducted on geographies consisting of 287,450,258 people shows a substantial positive correlation between the proportion of Haitians and percentage of households with no vehicle available in the United States with a correlation coefficient (R) of 0.578 and weighted average of 14.9%, a difference of 31.5%.
No Vehicles in Household Correlation Summary
| Measurement | Immigrants from Caribbean | Haitian |
| Minimum | 1.0% | 1.2% |
| Maximum | 52.3% | 100.0% |
| Range | 51.3% | 98.8% |
| Mean | 15.3% | 14.5% |
| Median | 12.4% | 11.3% |
| Interquartile 25% (IQ1) | 8.0% | 8.4% |
| Interquartile 75% (IQ3) | 19.3% | 14.7% |
| Interquartile Range (IQR) | 11.3% | 6.3% |
| Standard Deviation (Sample) | 10.8% | 13.9% |
| Standard Deviation (Population) | 10.8% | 13.8% |
Similar Demographics by No Vehicles in Household
Demographics Similar to Immigrants from Caribbean by No Vehicles in Household
In terms of no vehicles in household, the demographic groups most similar to Immigrants from Caribbean are Senegalese (19.8%, a difference of 0.72%), Immigrants from Yemen (19.5%, a difference of 0.73%), Immigrants from West Indies (20.5%, a difference of 4.7%), Immigrants from Cabo Verde (18.4%, a difference of 6.3%), and Immigrants from Senegal (21.1%, a difference of 7.8%).
| Demographics | Rating | Rank | No Vehicles in Household |
| Immigrants | Ghana | 0.0 /100 | #317 | Tragic 16.6% |
| Immigrants | Belarus | 0.0 /100 | #318 | Tragic 16.7% |
| Alaska Natives | 0.0 /100 | #319 | Tragic 17.4% |
| Soviet Union | 0.0 /100 | #320 | Tragic 17.4% |
| Jamaicans | 0.0 /100 | #321 | Tragic 17.9% |
| Immigrants | Cabo Verde | 0.0 /100 | #322 | Tragic 18.4% |
| Immigrants | Yemen | 0.0 /100 | #323 | Tragic 19.5% |
| Immigrants | Caribbean | 0.0 /100 | #324 | Tragic 19.6% |
| Senegalese | 0.0 /100 | #325 | Tragic 19.8% |
| Immigrants | West Indies | 0.0 /100 | #326 | Tragic 20.5% |
| Immigrants | Senegal | 0.0 /100 | #327 | Tragic 21.1% |
| Immigrants | Dominica | 0.0 /100 | #328 | Tragic 22.2% |
| Ecuadorians | 0.0 /100 | #329 | Tragic 22.8% |
| West Indians | 0.0 /100 | #330 | Tragic 23.7% |
| Trinidadians and Tobagonians | 0.0 /100 | #331 | Tragic 23.7% |
Demographics Similar to Haitians by No Vehicles in Household
In terms of no vehicles in household, the demographic groups most similar to Haitians are Immigrants from Ukraine (14.9%, a difference of 0.47%), Yuman (14.9%, a difference of 0.48%), Immigrants from Western Africa (15.0%, a difference of 0.52%), Immigrants from Russia (15.1%, a difference of 1.2%), and Immigrants from Greece (14.7%, a difference of 1.5%).
| Demographics | Rating | Rank | No Vehicles in Household |
| Paraguayans | 0.0 /100 | #295 | Tragic 14.4% |
| Immigrants | Spain | 0.0 /100 | #296 | Tragic 14.5% |
| Immigrants | Panama | 0.0 /100 | #297 | Tragic 14.6% |
| Moroccans | 0.0 /100 | #298 | Tragic 14.7% |
| Immigrants | Greece | 0.0 /100 | #299 | Tragic 14.7% |
| Yuman | 0.0 /100 | #300 | Tragic 14.9% |
| Immigrants | Ukraine | 0.0 /100 | #301 | Tragic 14.9% |
| Haitians | 0.0 /100 | #302 | Tragic 14.9% |
| Immigrants | Western Africa | 0.0 /100 | #303 | Tragic 15.0% |
| Immigrants | Russia | 0.0 /100 | #304 | Tragic 15.1% |
| Immigrants | China | 0.0 /100 | #305 | Tragic 15.2% |
| Immigrants | Belize | 0.0 /100 | #306 | Tragic 15.4% |
| Immigrants | Haiti | 0.0 /100 | #307 | Tragic 15.4% |
| U.S. Virgin Islanders | 0.0 /100 | #308 | Tragic 15.4% |
| Puerto Ricans | 0.0 /100 | #309 | Tragic 15.5% |