Immigrants from Caribbean vs British West Indian No Vehicles in Household
COMPARE
Immigrants from Caribbean
British West Indian
No Vehicles in Household
No Vehicles in Household Comparison
Immigrants from Caribbean
British West Indians
19.6%
NO VEHICLES IN HOUSEHOLD
0.0/ 100
METRIC RATING
324th/ 347
METRIC RANK
29.7%
NO VEHICLES IN HOUSEHOLD
0.0/ 100
METRIC RATING
342nd/ 347
METRIC RANK
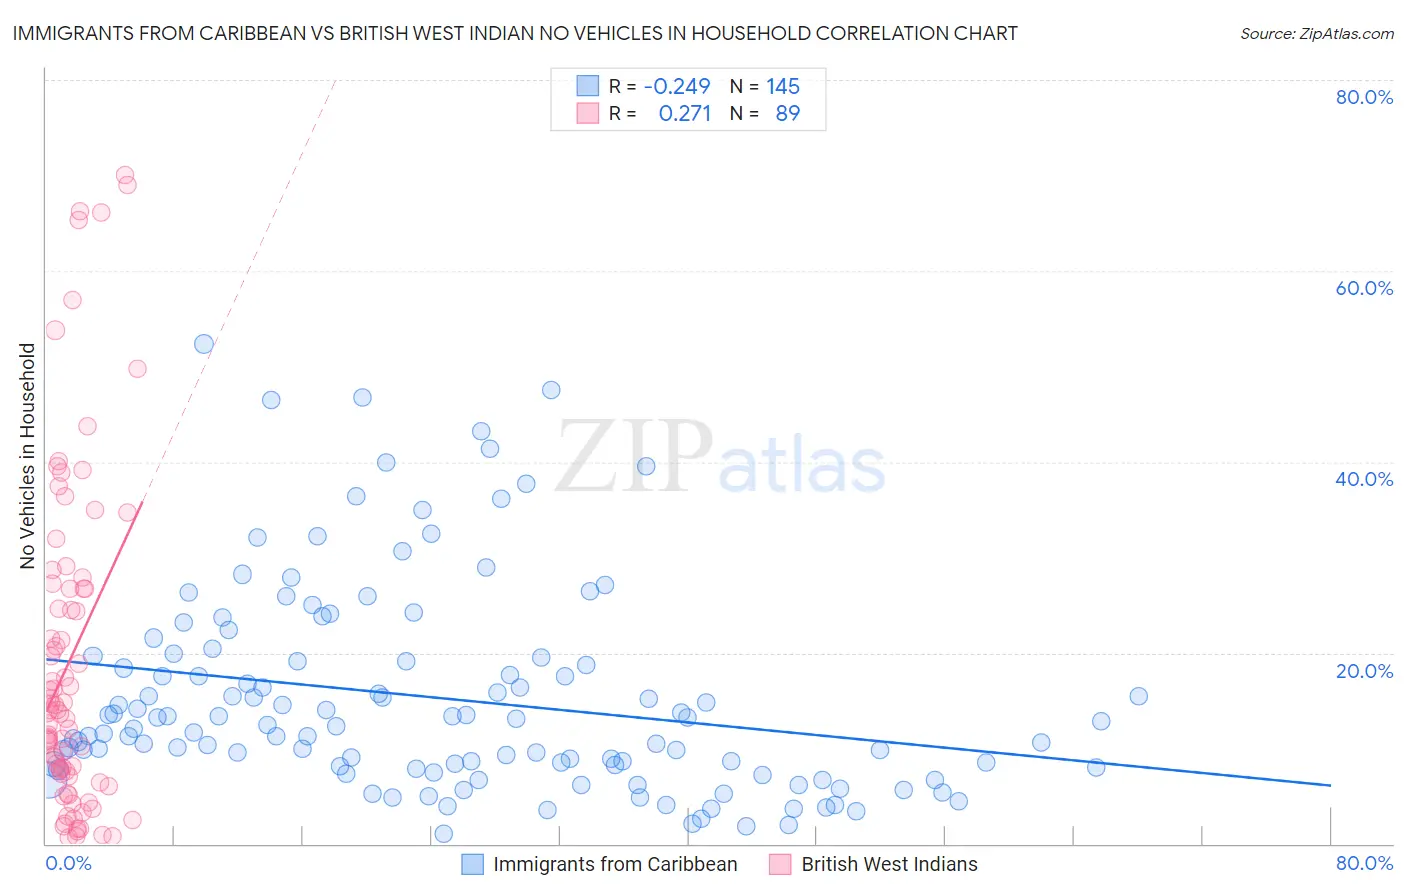
Immigrants from Caribbean vs British West Indian No Vehicles in Household Correlation Chart
The statistical analysis conducted on geographies consisting of 448,573,126 people shows a weak negative correlation between the proportion of Immigrants from Caribbean and percentage of households with no vehicle available in the United States with a correlation coefficient (R) of -0.249 and weighted average of 19.6%. Similarly, the statistical analysis conducted on geographies consisting of 152,511,245 people shows a weak positive correlation between the proportion of British West Indians and percentage of households with no vehicle available in the United States with a correlation coefficient (R) of 0.271 and weighted average of 29.7%, a difference of 51.6%.
No Vehicles in Household Correlation Summary
| Measurement | Immigrants from Caribbean | British West Indian |
| Minimum | 1.0% | 0.70% |
| Maximum | 52.3% | 70.0% |
| Range | 51.3% | 69.3% |
| Mean | 15.3% | 19.4% |
| Median | 12.4% | 14.1% |
| Interquartile 25% (IQ1) | 8.0% | 7.2% |
| Interquartile 75% (IQ3) | 19.3% | 27.0% |
| Interquartile Range (IQR) | 11.3% | 19.9% |
| Standard Deviation (Sample) | 10.8% | 17.5% |
| Standard Deviation (Population) | 10.8% | 17.4% |
Demographics Similar to Immigrants from Caribbean and British West Indians by No Vehicles in Household
In terms of no vehicles in household, the demographic groups most similar to Immigrants from Caribbean are Senegalese (19.8%, a difference of 0.72%), Immigrants from Yemen (19.5%, a difference of 0.73%), Immigrants from West Indies (20.5%, a difference of 4.7%), Immigrants from Senegal (21.1%, a difference of 7.8%), and Immigrants from Dominica (22.2%, a difference of 13.4%). Similarly, the demographic groups most similar to British West Indians are Inupiat (29.9%, a difference of 0.41%), Immigrants from Guyana (29.5%, a difference of 0.85%), Immigrants from Barbados (29.5%, a difference of 0.90%), Dominican (29.4%, a difference of 1.1%), and Guyanese (29.3%, a difference of 1.5%).
| Demographics | Rating | Rank | No Vehicles in Household |
| Immigrants | Yemen | 0.0 /100 | #323 | Tragic 19.5% |
| Immigrants | Caribbean | 0.0 /100 | #324 | Tragic 19.6% |
| Senegalese | 0.0 /100 | #325 | Tragic 19.8% |
| Immigrants | West Indies | 0.0 /100 | #326 | Tragic 20.5% |
| Immigrants | Senegal | 0.0 /100 | #327 | Tragic 21.1% |
| Immigrants | Dominica | 0.0 /100 | #328 | Tragic 22.2% |
| Ecuadorians | 0.0 /100 | #329 | Tragic 22.8% |
| West Indians | 0.0 /100 | #330 | Tragic 23.7% |
| Trinidadians and Tobagonians | 0.0 /100 | #331 | Tragic 23.7% |
| Immigrants | Ecuador | 0.0 /100 | #332 | Tragic 23.8% |
| Immigrants | Trinidad and Tobago | 0.0 /100 | #333 | Tragic 24.6% |
| Immigrants | Bangladesh | 0.0 /100 | #334 | Tragic 25.8% |
| Barbadians | 0.0 /100 | #335 | Tragic 26.1% |
| Vietnamese | 0.0 /100 | #336 | Tragic 26.2% |
| Immigrants | Uzbekistan | 0.0 /100 | #337 | Tragic 26.7% |
| Guyanese | 0.0 /100 | #338 | Tragic 29.3% |
| Dominicans | 0.0 /100 | #339 | Tragic 29.4% |
| Immigrants | Barbados | 0.0 /100 | #340 | Tragic 29.5% |
| Immigrants | Guyana | 0.0 /100 | #341 | Tragic 29.5% |
| British West Indians | 0.0 /100 | #342 | Tragic 29.7% |
| Inupiat | 0.0 /100 | #343 | Tragic 29.9% |