Immigrants from Cambodia vs Immigrants from Brazil 2 or more Vehicles in Household
COMPARE
Immigrants from Cambodia
Immigrants from Brazil
2 or more Vehicles in Household
2 or more Vehicles in Household Comparison
Immigrants from Cambodia
Immigrants from Brazil
56.2%
2 OR MORE VEHICLES IN HOUSEHOLD
83.6/ 100
METRIC RATING
141st/ 347
METRIC RANK
52.8%
2 OR MORE VEHICLES IN HOUSEHOLD
1.0/ 100
METRIC RATING
249th/ 347
METRIC RANK
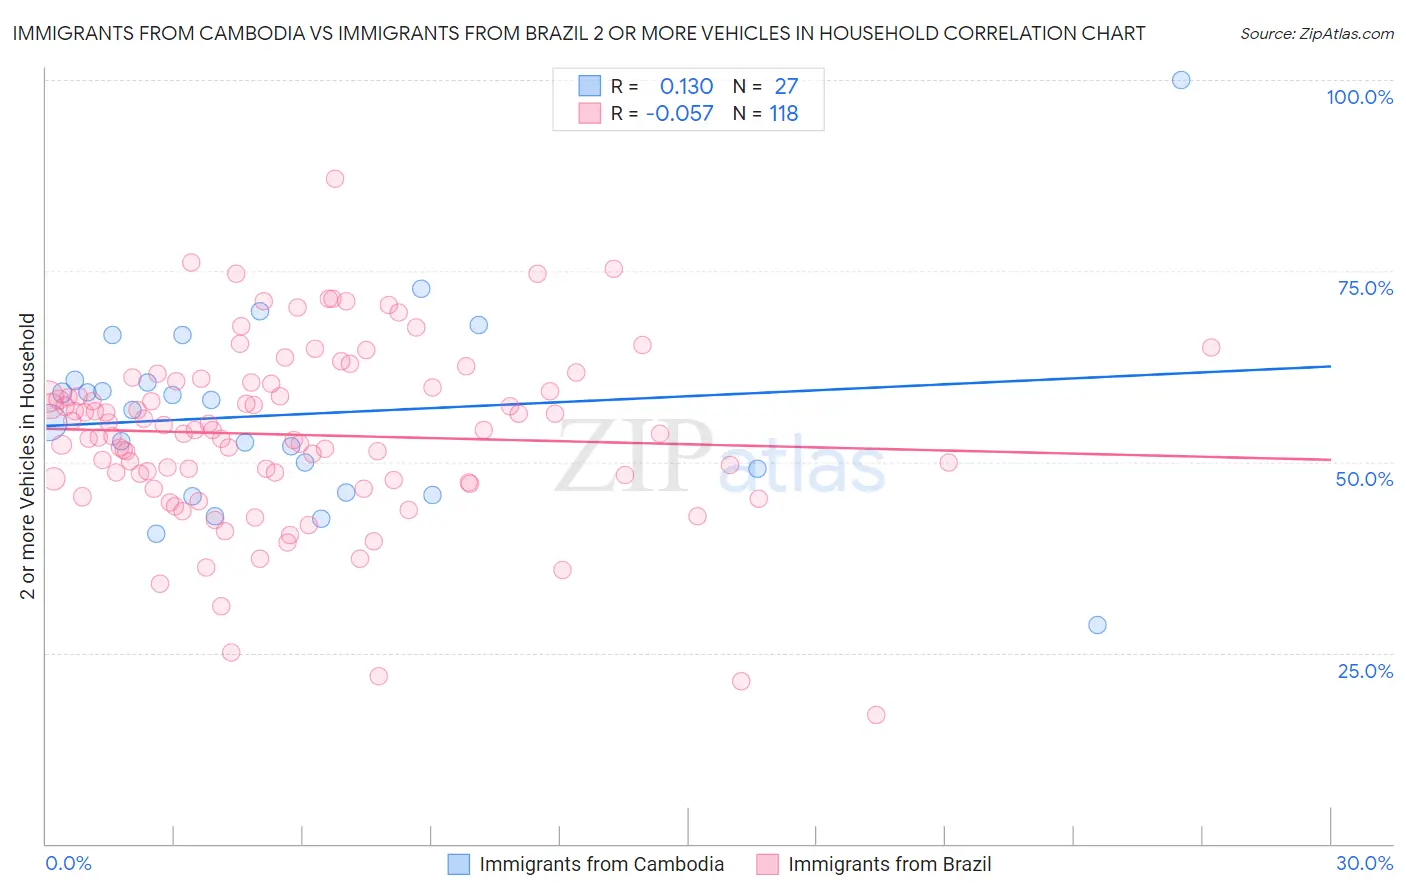
Immigrants from Cambodia vs Immigrants from Brazil 2 or more Vehicles in Household Correlation Chart
The statistical analysis conducted on geographies consisting of 205,137,461 people shows a poor positive correlation between the proportion of Immigrants from Cambodia and percentage of households with 2 or more vehicles available in the United States with a correlation coefficient (R) of 0.130 and weighted average of 56.2%. Similarly, the statistical analysis conducted on geographies consisting of 342,889,172 people shows a slight negative correlation between the proportion of Immigrants from Brazil and percentage of households with 2 or more vehicles available in the United States with a correlation coefficient (R) of -0.057 and weighted average of 52.8%, a difference of 6.5%.
2 or more Vehicles in Household Correlation Summary
| Measurement | Immigrants from Cambodia | Immigrants from Brazil |
| Minimum | 28.6% | 16.9% |
| Maximum | 100.0% | 87.2% |
| Range | 71.4% | 70.3% |
| Mean | 56.3% | 53.6% |
| Median | 56.8% | 53.9% |
| Interquartile 25% (IQ1) | 46.0% | 47.6% |
| Interquartile 75% (IQ3) | 60.7% | 60.3% |
| Interquartile Range (IQR) | 14.7% | 12.7% |
| Standard Deviation (Sample) | 13.4% | 11.6% |
| Standard Deviation (Population) | 13.1% | 11.6% |
Similar Demographics by 2 or more Vehicles in Household
Demographics Similar to Immigrants from Cambodia by 2 or more Vehicles in Household
In terms of 2 or more vehicles in household, the demographic groups most similar to Immigrants from Cambodia are Latvian (56.2%, a difference of 0.0%), South African (56.2%, a difference of 0.040%), Armenian (56.3%, a difference of 0.050%), Salvadoran (56.3%, a difference of 0.080%), and Cuban (56.3%, a difference of 0.090%).
| Demographics | Rating | Rank | 2 or more Vehicles in Household |
| Immigrants | Azores | 86.6 /100 | #134 | Excellent 56.4% |
| Blackfeet | 86.5 /100 | #135 | Excellent 56.4% |
| Immigrants | Asia | 86.0 /100 | #136 | Excellent 56.3% |
| Cubans | 84.8 /100 | #137 | Excellent 56.3% |
| Salvadorans | 84.7 /100 | #138 | Excellent 56.3% |
| Armenians | 84.3 /100 | #139 | Excellent 56.3% |
| Latvians | 83.6 /100 | #140 | Excellent 56.2% |
| Immigrants | Cambodia | 83.6 /100 | #141 | Excellent 56.2% |
| South Africans | 83.1 /100 | #142 | Excellent 56.2% |
| Seminole | 81.7 /100 | #143 | Excellent 56.2% |
| Immigrants | Syria | 81.4 /100 | #144 | Excellent 56.2% |
| Syrians | 81.2 /100 | #145 | Excellent 56.2% |
| Venezuelans | 80.7 /100 | #146 | Excellent 56.1% |
| Serbians | 80.3 /100 | #147 | Excellent 56.1% |
| Immigrants | Moldova | 80.2 /100 | #148 | Excellent 56.1% |
Demographics Similar to Immigrants from Brazil by 2 or more Vehicles in Household
In terms of 2 or more vehicles in household, the demographic groups most similar to Immigrants from Brazil are Mongolian (52.8%, a difference of 0.0%), Immigrants from Sudan (52.8%, a difference of 0.040%), Immigrants from Portugal (52.8%, a difference of 0.050%), Colombian (52.9%, a difference of 0.060%), and Nigerian (52.8%, a difference of 0.10%).
| Demographics | Rating | Rank | 2 or more Vehicles in Household |
| Immigrants | Eastern Asia | 2.1 /100 | #242 | Tragic 53.2% |
| Ethiopians | 1.7 /100 | #243 | Tragic 53.1% |
| Indians (Asian) | 1.7 /100 | #244 | Tragic 53.1% |
| Immigrants | Ethiopia | 1.5 /100 | #245 | Tragic 53.0% |
| Immigrants | Nigeria | 1.2 /100 | #246 | Tragic 52.9% |
| Sierra Leoneans | 1.2 /100 | #247 | Tragic 52.9% |
| Colombians | 1.1 /100 | #248 | Tragic 52.9% |
| Immigrants | Brazil | 1.0 /100 | #249 | Tragic 52.8% |
| Mongolians | 1.0 /100 | #250 | Tragic 52.8% |
| Immigrants | Sudan | 1.0 /100 | #251 | Tragic 52.8% |
| Immigrants | Portugal | 1.0 /100 | #252 | Tragic 52.8% |
| Nigerians | 0.9 /100 | #253 | Tragic 52.8% |
| Immigrants | Malaysia | 0.8 /100 | #254 | Tragic 52.7% |
| Uruguayans | 0.7 /100 | #255 | Tragic 52.7% |
| Immigrants | Eritrea | 0.7 /100 | #256 | Tragic 52.6% |