Immigrants from Burma/Myanmar vs Immigrants from Turkey 7th Grade
COMPARE
Immigrants from Burma/Myanmar
Immigrants from Turkey
7th Grade
7th Grade Comparison
Immigrants from Burma/Myanmar
Immigrants from Turkey
94.5%
7TH GRADE
0.0/ 100
METRIC RATING
300th/ 347
METRIC RANK
96.4%
7TH GRADE
90.2/ 100
METRIC RATING
137th/ 347
METRIC RANK
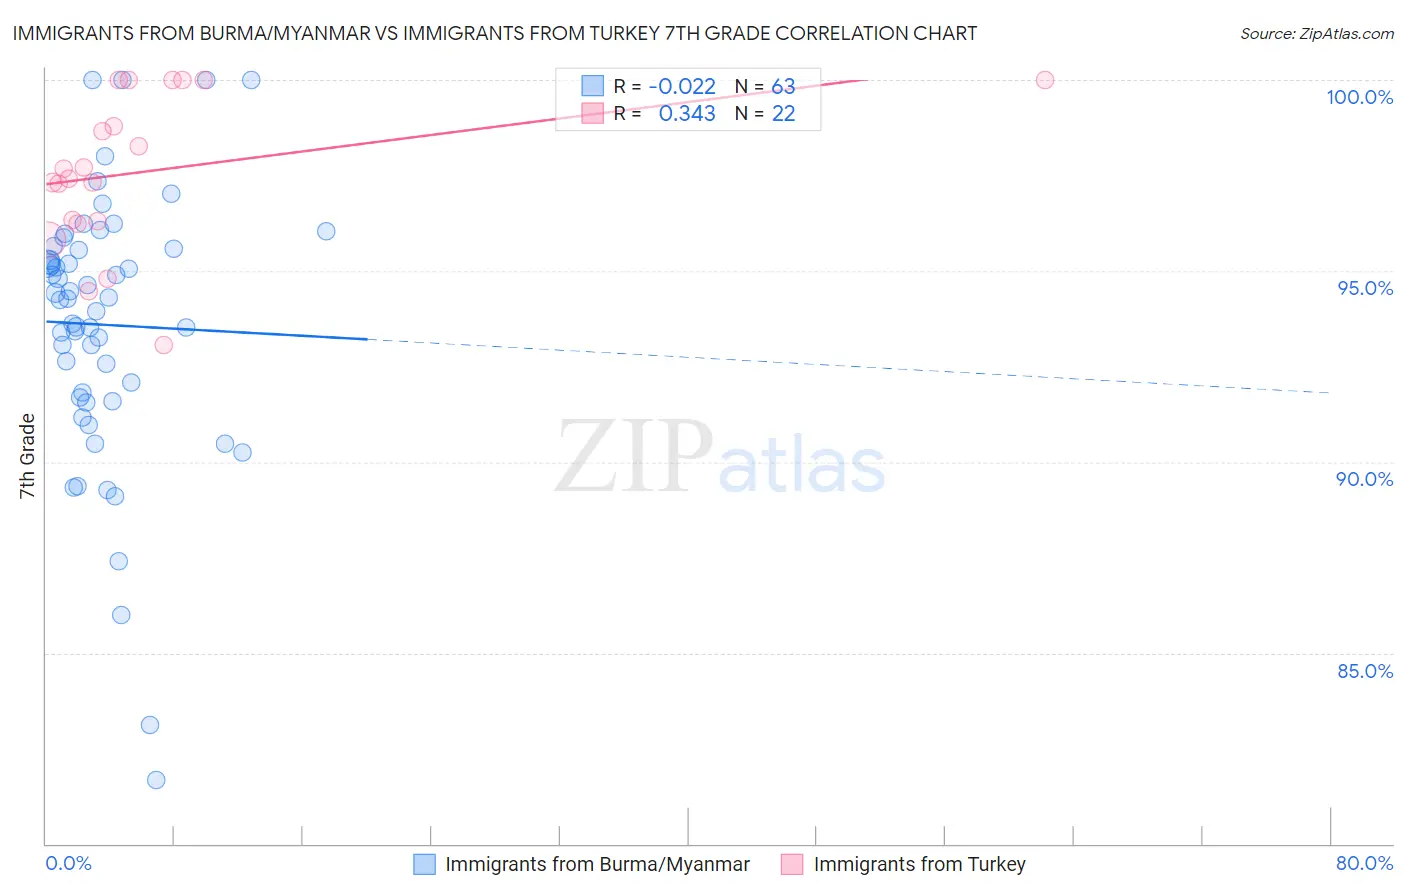
Immigrants from Burma/Myanmar vs Immigrants from Turkey 7th Grade Correlation Chart
The statistical analysis conducted on geographies consisting of 172,345,696 people shows no correlation between the proportion of Immigrants from Burma/Myanmar and percentage of population with at least 7th grade education in the United States with a correlation coefficient (R) of -0.022 and weighted average of 94.5%. Similarly, the statistical analysis conducted on geographies consisting of 223,057,877 people shows a mild positive correlation between the proportion of Immigrants from Turkey and percentage of population with at least 7th grade education in the United States with a correlation coefficient (R) of 0.343 and weighted average of 96.4%, a difference of 2.0%.
7th Grade Correlation Summary
| Measurement | Immigrants from Burma/Myanmar | Immigrants from Turkey |
| Minimum | 81.7% | 93.1% |
| Maximum | 100.0% | 100.0% |
| Range | 18.3% | 6.9% |
| Mean | 93.6% | 97.6% |
| Median | 94.3% | 97.6% |
| Interquartile 25% (IQ1) | 91.7% | 96.3% |
| Interquartile 75% (IQ3) | 95.6% | 100.0% |
| Interquartile Range (IQR) | 3.9% | 3.7% |
| Standard Deviation (Sample) | 3.6% | 2.0% |
| Standard Deviation (Population) | 3.5% | 2.0% |
Similar Demographics by 7th Grade
Demographics Similar to Immigrants from Burma/Myanmar by 7th Grade
In terms of 7th grade, the demographic groups most similar to Immigrants from Burma/Myanmar are Immigrants from Dominica (94.5%, a difference of 0.030%), Immigrants from Laos (94.5%, a difference of 0.030%), Immigrants from South Eastern Asia (94.5%, a difference of 0.040%), Indonesian (94.5%, a difference of 0.040%), and Bangladeshi (94.5%, a difference of 0.040%).
| Demographics | Rating | Rank | 7th Grade |
| Fijians | 0.0 /100 | #293 | Tragic 94.7% |
| Haitians | 0.0 /100 | #294 | Tragic 94.7% |
| Yaqui | 0.0 /100 | #295 | Tragic 94.6% |
| Cubans | 0.0 /100 | #296 | Tragic 94.6% |
| Immigrants | South Eastern Asia | 0.0 /100 | #297 | Tragic 94.5% |
| Indonesians | 0.0 /100 | #298 | Tragic 94.5% |
| Bangladeshis | 0.0 /100 | #299 | Tragic 94.5% |
| Immigrants | Burma/Myanmar | 0.0 /100 | #300 | Tragic 94.5% |
| Immigrants | Dominica | 0.0 /100 | #301 | Tragic 94.5% |
| Immigrants | Laos | 0.0 /100 | #302 | Tragic 94.5% |
| Sri Lankans | 0.0 /100 | #303 | Tragic 94.4% |
| Immigrants | Haiti | 0.0 /100 | #304 | Tragic 94.3% |
| Guyanese | 0.0 /100 | #305 | Tragic 94.3% |
| Immigrants | Guyana | 0.0 /100 | #306 | Tragic 94.2% |
| Immigrants | Portugal | 0.0 /100 | #307 | Tragic 94.2% |
Demographics Similar to Immigrants from Turkey by 7th Grade
In terms of 7th grade, the demographic groups most similar to Immigrants from Turkey are Jordanian (96.4%, a difference of 0.0%), Immigrants from Hungary (96.4%, a difference of 0.010%), Hmong (96.4%, a difference of 0.020%), Soviet Union (96.4%, a difference of 0.020%), and Immigrants from Kuwait (96.4%, a difference of 0.020%).
| Demographics | Rating | Rank | 7th Grade |
| Immigrants | Serbia | 92.8 /100 | #130 | Exceptional 96.4% |
| Filipinos | 92.1 /100 | #131 | Exceptional 96.4% |
| Colville | 91.7 /100 | #132 | Exceptional 96.4% |
| Hmong | 91.5 /100 | #133 | Exceptional 96.4% |
| Soviet Union | 91.2 /100 | #134 | Exceptional 96.4% |
| Immigrants | Kuwait | 91.1 /100 | #135 | Exceptional 96.4% |
| Immigrants | Hungary | 90.6 /100 | #136 | Exceptional 96.4% |
| Immigrants | Turkey | 90.2 /100 | #137 | Exceptional 96.4% |
| Jordanians | 90.0 /100 | #138 | Excellent 96.4% |
| Basques | 89.3 /100 | #139 | Excellent 96.4% |
| Cambodians | 88.3 /100 | #140 | Excellent 96.3% |
| Immigrants | South Central Asia | 87.1 /100 | #141 | Excellent 96.3% |
| Burmese | 87.1 /100 | #142 | Excellent 96.3% |
| Spanish | 86.6 /100 | #143 | Excellent 96.3% |
| Immigrants | Greece | 85.9 /100 | #144 | Excellent 96.3% |