Immigrants from Bolivia vs Portuguese No Vehicles in Household
COMPARE
Immigrants from Bolivia
Portuguese
No Vehicles in Household
No Vehicles in Household Comparison
Immigrants from Bolivia
Portuguese
8.9%
NO VEHICLES IN HOUSEHOLD
98.7/ 100
METRIC RATING
96th/ 347
METRIC RANK
8.6%
NO VEHICLES IN HOUSEHOLD
99.5/ 100
METRIC RATING
79th/ 347
METRIC RANK
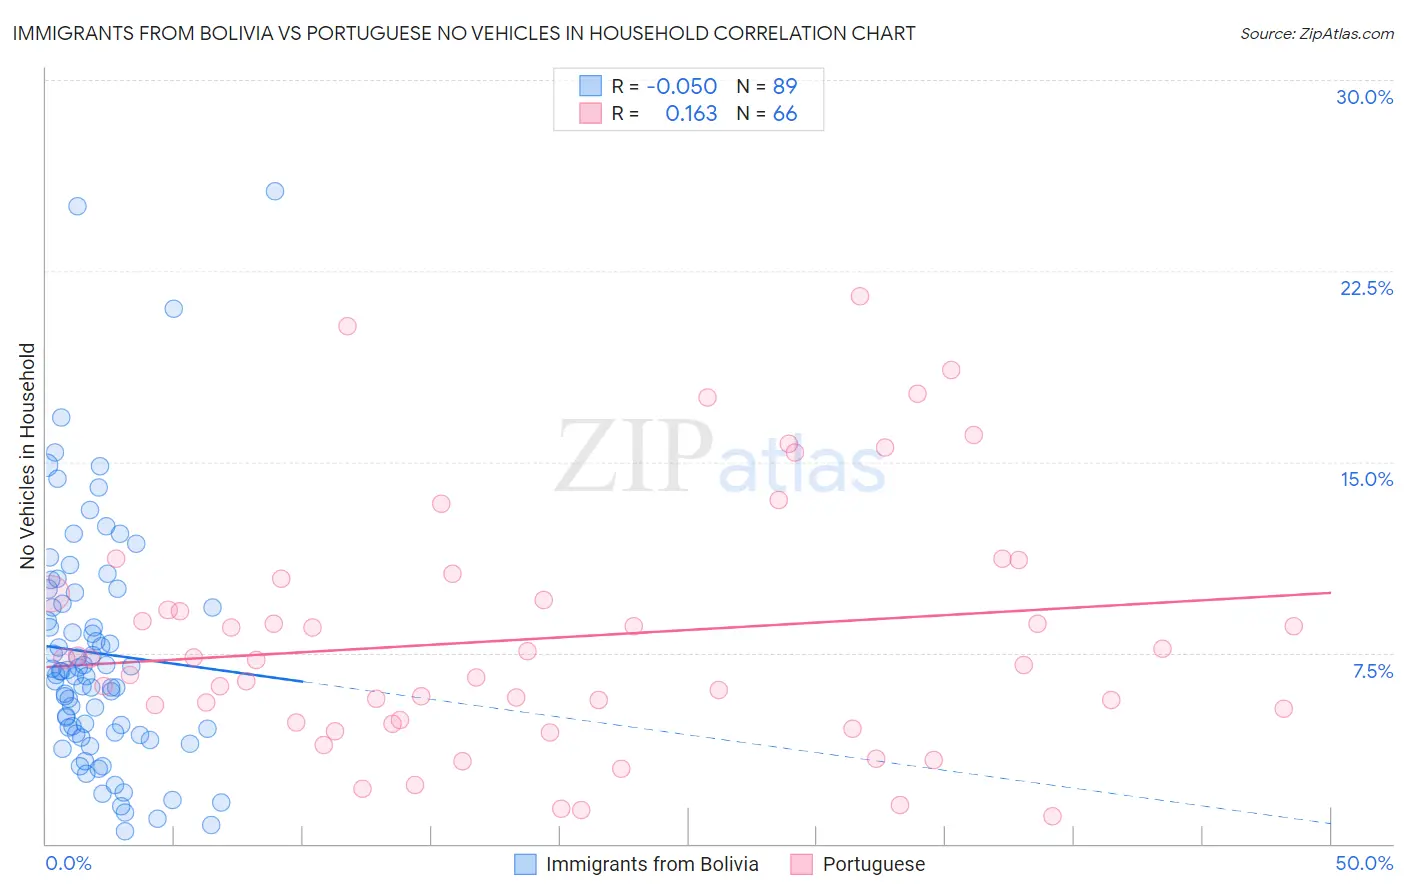
Immigrants from Bolivia vs Portuguese No Vehicles in Household Correlation Chart
The statistical analysis conducted on geographies consisting of 158,658,153 people shows a slight negative correlation between the proportion of Immigrants from Bolivia and percentage of households with no vehicle available in the United States with a correlation coefficient (R) of -0.050 and weighted average of 8.9%. Similarly, the statistical analysis conducted on geographies consisting of 448,384,012 people shows a poor positive correlation between the proportion of Portuguese and percentage of households with no vehicle available in the United States with a correlation coefficient (R) of 0.163 and weighted average of 8.6%, a difference of 3.4%.
No Vehicles in Household Correlation Summary
| Measurement | Immigrants from Bolivia | Portuguese |
| Minimum | 0.50% | 1.1% |
| Maximum | 25.6% | 21.5% |
| Range | 25.1% | 20.4% |
| Mean | 7.5% | 8.1% |
| Median | 6.8% | 7.3% |
| Interquartile 25% (IQ1) | 4.4% | 4.9% |
| Interquartile 75% (IQ3) | 9.6% | 9.8% |
| Interquartile Range (IQR) | 5.3% | 4.9% |
| Standard Deviation (Sample) | 4.8% | 4.8% |
| Standard Deviation (Population) | 4.8% | 4.7% |
Demographics Similar to Immigrants from Bolivia and Portuguese by No Vehicles in Household
In terms of no vehicles in household, the demographic groups most similar to Immigrants from Bolivia are Potawatomi (8.8%, a difference of 0.28%), Austrian (8.8%, a difference of 0.43%), Immigrants from Central America (8.9%, a difference of 0.66%), Immigrants from North America (8.7%, a difference of 1.4%), and Immigrants from Canada (8.7%, a difference of 1.5%). Similarly, the demographic groups most similar to Portuguese are Immigrants from South Central Asia (8.6%, a difference of 0.060%), Bolivian (8.6%, a difference of 0.15%), Iranian (8.6%, a difference of 0.18%), Tsimshian (8.6%, a difference of 0.20%), and Immigrants from South Eastern Asia (8.6%, a difference of 0.33%).
| Demographics | Rating | Rank | No Vehicles in Household |
| Iranians | 99.5 /100 | #77 | Exceptional 8.6% |
| Immigrants | South Central Asia | 99.5 /100 | #78 | Exceptional 8.6% |
| Portuguese | 99.5 /100 | #79 | Exceptional 8.6% |
| Bolivians | 99.4 /100 | #80 | Exceptional 8.6% |
| Tsimshian | 99.4 /100 | #81 | Exceptional 8.6% |
| Immigrants | South Eastern Asia | 99.4 /100 | #82 | Exceptional 8.6% |
| Italians | 99.4 /100 | #83 | Exceptional 8.6% |
| Immigrants | Jordan | 99.3 /100 | #84 | Exceptional 8.7% |
| Lebanese | 99.3 /100 | #85 | Exceptional 8.7% |
| Bangladeshis | 99.3 /100 | #86 | Exceptional 8.7% |
| Immigrants | England | 99.2 /100 | #87 | Exceptional 8.7% |
| Osage | 99.2 /100 | #88 | Exceptional 8.7% |
| Immigrants | Cuba | 99.2 /100 | #89 | Exceptional 8.7% |
| Bhutanese | 99.2 /100 | #90 | Exceptional 8.7% |
| Immigrants | Germany | 99.1 /100 | #91 | Exceptional 8.7% |
| Immigrants | Canada | 99.1 /100 | #92 | Exceptional 8.7% |
| Immigrants | North America | 99.1 /100 | #93 | Exceptional 8.7% |
| Austrians | 98.9 /100 | #94 | Exceptional 8.8% |
| Potawatomi | 98.8 /100 | #95 | Exceptional 8.8% |
| Immigrants | Bolivia | 98.7 /100 | #96 | Exceptional 8.9% |
| Immigrants | Central America | 98.5 /100 | #97 | Exceptional 8.9% |