Immigrants from Bolivia vs Asian No Vehicles in Household
COMPARE
Immigrants from Bolivia
Asian
No Vehicles in Household
No Vehicles in Household Comparison
Immigrants from Bolivia
Asians
8.9%
NO VEHICLES IN HOUSEHOLD
98.7/ 100
METRIC RATING
96th/ 347
METRIC RANK
9.0%
NO VEHICLES IN HOUSEHOLD
98.3/ 100
METRIC RATING
100th/ 347
METRIC RANK
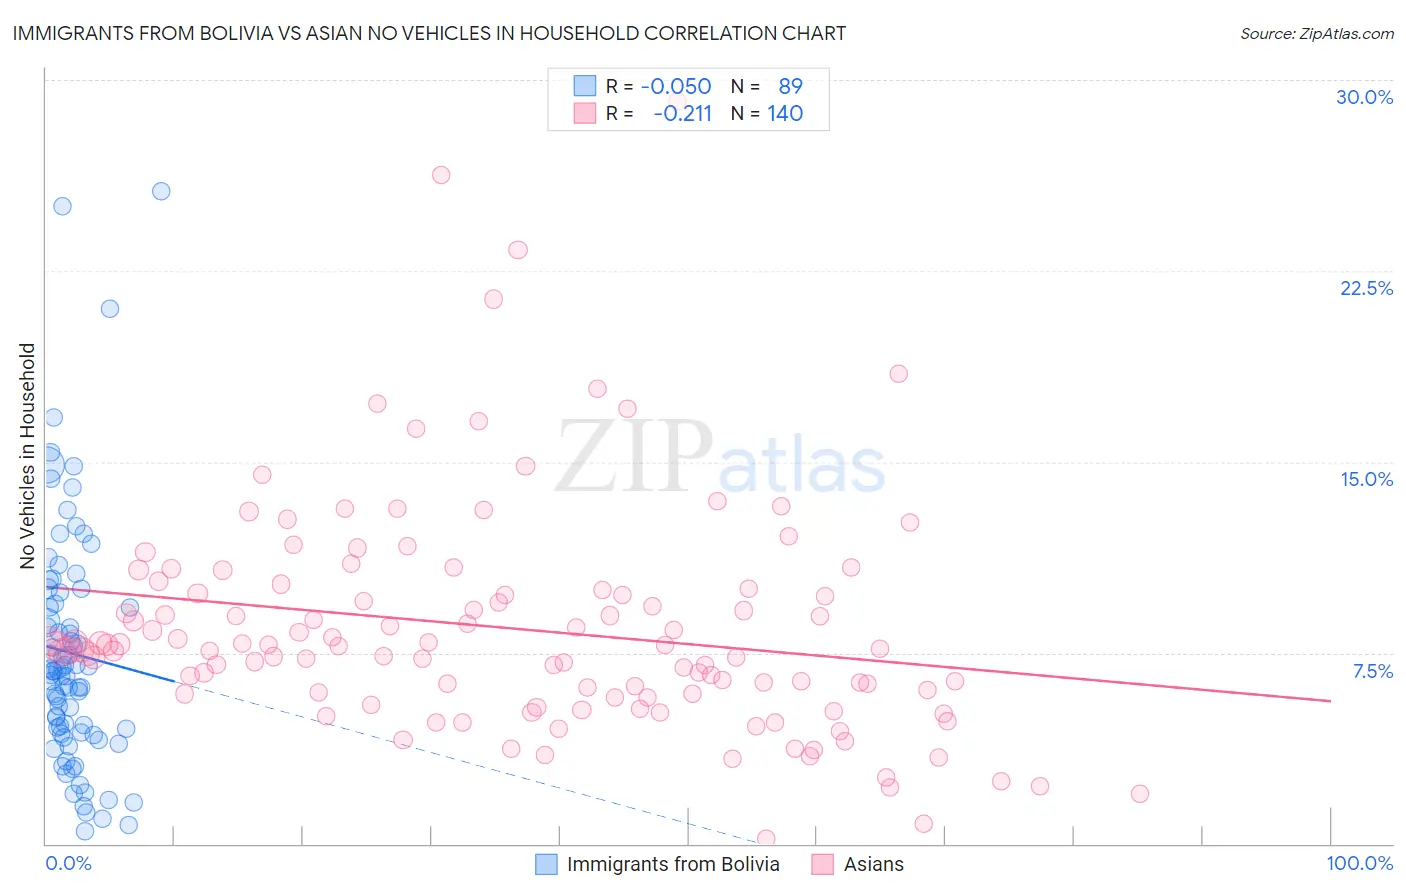
Immigrants from Bolivia vs Asian No Vehicles in Household Correlation Chart
The statistical analysis conducted on geographies consisting of 158,658,153 people shows a slight negative correlation between the proportion of Immigrants from Bolivia and percentage of households with no vehicle available in the United States with a correlation coefficient (R) of -0.050 and weighted average of 8.9%. Similarly, the statistical analysis conducted on geographies consisting of 534,555,995 people shows a weak negative correlation between the proportion of Asians and percentage of households with no vehicle available in the United States with a correlation coefficient (R) of -0.211 and weighted average of 9.0%, a difference of 1.2%.
No Vehicles in Household Correlation Summary
| Measurement | Immigrants from Bolivia | Asian |
| Minimum | 0.50% | 0.21% |
| Maximum | 25.6% | 29.2% |
| Range | 25.1% | 29.0% |
| Mean | 7.5% | 8.5% |
| Median | 6.8% | 7.7% |
| Interquartile 25% (IQ1) | 4.4% | 5.9% |
| Interquartile 75% (IQ3) | 9.6% | 9.9% |
| Interquartile Range (IQR) | 5.3% | 4.0% |
| Standard Deviation (Sample) | 4.8% | 4.5% |
| Standard Deviation (Population) | 4.8% | 4.5% |
Demographics Similar to Immigrants from Bolivia and Asians by No Vehicles in Household
In terms of no vehicles in household, the demographic groups most similar to Immigrants from Bolivia are Potawatomi (8.8%, a difference of 0.28%), Austrian (8.8%, a difference of 0.43%), Immigrants from Central America (8.9%, a difference of 0.66%), Slavic (9.0%, a difference of 0.97%), and Bulgarian (9.0%, a difference of 1.0%). Similarly, the demographic groups most similar to Asians are Pakistani (9.0%, a difference of 0.040%), Yugoslavian (9.0%, a difference of 0.080%), Seminole (9.0%, a difference of 0.080%), Bulgarian (9.0%, a difference of 0.18%), and Slavic (9.0%, a difference of 0.24%).
| Demographics | Rating | Rank | No Vehicles in Household |
| Osage | 99.2 /100 | #88 | Exceptional 8.7% |
| Immigrants | Cuba | 99.2 /100 | #89 | Exceptional 8.7% |
| Bhutanese | 99.2 /100 | #90 | Exceptional 8.7% |
| Immigrants | Germany | 99.1 /100 | #91 | Exceptional 8.7% |
| Immigrants | Canada | 99.1 /100 | #92 | Exceptional 8.7% |
| Immigrants | North America | 99.1 /100 | #93 | Exceptional 8.7% |
| Austrians | 98.9 /100 | #94 | Exceptional 8.8% |
| Potawatomi | 98.8 /100 | #95 | Exceptional 8.8% |
| Immigrants | Bolivia | 98.7 /100 | #96 | Exceptional 8.9% |
| Immigrants | Central America | 98.5 /100 | #97 | Exceptional 8.9% |
| Slavs | 98.4 /100 | #98 | Exceptional 9.0% |
| Bulgarians | 98.4 /100 | #99 | Exceptional 9.0% |
| Asians | 98.3 /100 | #100 | Exceptional 9.0% |
| Pakistanis | 98.3 /100 | #101 | Exceptional 9.0% |
| Yugoslavians | 98.3 /100 | #102 | Exceptional 9.0% |
| Seminole | 98.3 /100 | #103 | Exceptional 9.0% |
| Zimbabweans | 98.0 /100 | #104 | Exceptional 9.0% |
| Spanish Americans | 97.9 /100 | #105 | Exceptional 9.1% |
| Laotians | 97.8 /100 | #106 | Exceptional 9.1% |
| Hispanics or Latinos | 97.7 /100 | #107 | Exceptional 9.1% |
| Mexican American Indians | 97.6 /100 | #108 | Exceptional 9.1% |