Immigrants from Bolivia vs Portuguese In Labor Force | Age 45-54
COMPARE
Immigrants from Bolivia
Portuguese
In Labor Force | Age 45-54
In Labor Force | Age 45-54 Comparison
Immigrants from Bolivia
Portuguese
85.3%
IN LABOR FORCE | AGE 45-54
100.0/ 100
METRIC RATING
1st/ 347
METRIC RANK
82.2%
IN LABOR FORCE | AGE 45-54
4.7/ 100
METRIC RATING
217th/ 347
METRIC RANK
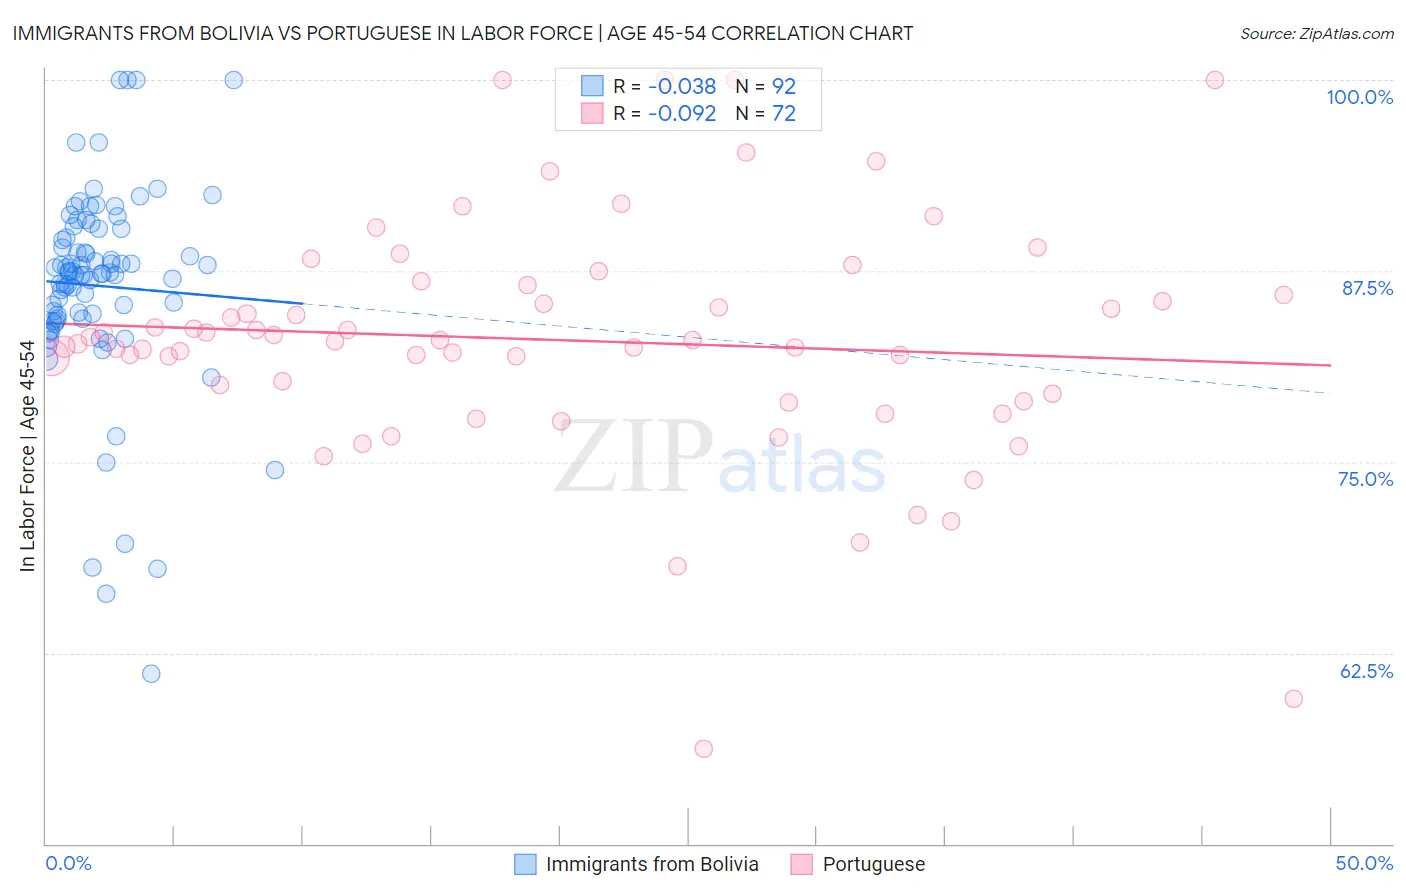
Immigrants from Bolivia vs Portuguese In Labor Force | Age 45-54 Correlation Chart
The statistical analysis conducted on geographies consisting of 158,712,400 people shows no correlation between the proportion of Immigrants from Bolivia and labor force participation rate among population between the ages 45 and 54 in the United States with a correlation coefficient (R) of -0.038 and weighted average of 85.3%. Similarly, the statistical analysis conducted on geographies consisting of 449,955,919 people shows a slight negative correlation between the proportion of Portuguese and labor force participation rate among population between the ages 45 and 54 in the United States with a correlation coefficient (R) of -0.092 and weighted average of 82.2%, a difference of 3.7%.
In Labor Force | Age 45-54 Correlation Summary
| Measurement | Immigrants from Bolivia | Portuguese |
| Minimum | 61.1% | 56.2% |
| Maximum | 100.0% | 100.0% |
| Range | 38.9% | 43.8% |
| Mean | 86.5% | 83.0% |
| Median | 87.3% | 82.9% |
| Interquartile 25% (IQ1) | 84.4% | 79.2% |
| Interquartile 75% (IQ3) | 90.0% | 86.2% |
| Interquartile Range (IQR) | 5.6% | 7.0% |
| Standard Deviation (Sample) | 6.6% | 7.9% |
| Standard Deviation (Population) | 6.6% | 7.9% |
Similar Demographics by In Labor Force | Age 45-54
Demographics Similar to Immigrants from Bolivia by In Labor Force | Age 45-54
In terms of in labor force | age 45-54, the demographic groups most similar to Immigrants from Bolivia are Luxembourger (85.0%, a difference of 0.34%), Bolivian (84.9%, a difference of 0.43%), Immigrants from Ethiopia (84.8%, a difference of 0.55%), Ethiopian (84.8%, a difference of 0.63%), and Immigrants from India (84.7%, a difference of 0.74%).
| Demographics | Rating | Rank | In Labor Force | Age 45-54 |
| Immigrants | Bolivia | 100.0 /100 | #1 | Exceptional 85.3% |
| Luxembourgers | 100.0 /100 | #2 | Exceptional 85.0% |
| Bolivians | 100.0 /100 | #3 | Exceptional 84.9% |
| Immigrants | Ethiopia | 100.0 /100 | #4 | Exceptional 84.8% |
| Ethiopians | 100.0 /100 | #5 | Exceptional 84.8% |
| Immigrants | India | 100.0 /100 | #6 | Exceptional 84.7% |
| Immigrants | Cameroon | 100.0 /100 | #7 | Exceptional 84.6% |
| Sierra Leoneans | 100.0 /100 | #8 | Exceptional 84.5% |
| Immigrants | Sierra Leone | 100.0 /100 | #9 | Exceptional 84.4% |
| Norwegians | 100.0 /100 | #10 | Exceptional 84.4% |
| Thais | 100.0 /100 | #11 | Exceptional 84.3% |
| Bulgarians | 100.0 /100 | #12 | Exceptional 84.2% |
| Chinese | 99.9 /100 | #13 | Exceptional 84.1% |
| Cambodians | 99.9 /100 | #14 | Exceptional 84.1% |
| Cypriots | 99.9 /100 | #15 | Exceptional 84.1% |
Demographics Similar to Portuguese by In Labor Force | Age 45-54
In terms of in labor force | age 45-54, the demographic groups most similar to Portuguese are English (82.2%, a difference of 0.020%), Scottish (82.2%, a difference of 0.030%), French (82.2%, a difference of 0.030%), Immigrants from Panama (82.2%, a difference of 0.040%), and Iraqi (82.2%, a difference of 0.040%).
| Demographics | Rating | Rank | In Labor Force | Age 45-54 |
| Immigrants | Bahamas | 7.1 /100 | #210 | Tragic 82.3% |
| Immigrants | Syria | 6.6 /100 | #211 | Tragic 82.3% |
| Ecuadorians | 6.3 /100 | #212 | Tragic 82.3% |
| Immigrants | Uzbekistan | 5.8 /100 | #213 | Tragic 82.3% |
| Immigrants | Panama | 5.6 /100 | #214 | Tragic 82.2% |
| Iraqis | 5.6 /100 | #215 | Tragic 82.2% |
| Scottish | 5.3 /100 | #216 | Tragic 82.2% |
| Portuguese | 4.7 /100 | #217 | Tragic 82.2% |
| English | 4.4 /100 | #218 | Tragic 82.2% |
| French | 4.1 /100 | #219 | Tragic 82.2% |
| Bahamians | 3.6 /100 | #220 | Tragic 82.2% |
| Panamanians | 3.5 /100 | #221 | Tragic 82.2% |
| Immigrants | Ecuador | 3.4 /100 | #222 | Tragic 82.2% |
| Immigrants | Immigrants | 3.1 /100 | #223 | Tragic 82.1% |
| Immigrants | Jamaica | 2.7 /100 | #224 | Tragic 82.1% |