Immigrants from Belgium vs Immigrants from Vietnam 1 or more Vehicles in Household
COMPARE
Immigrants from Belgium
Immigrants from Vietnam
1 or more Vehicles in Household
1 or more Vehicles in Household Comparison
Immigrants from Belgium
Immigrants from Vietnam
88.4%
1 OR MORE VEHICLES IN HOUSEHOLD
2.1/ 100
METRIC RATING
243rd/ 347
METRIC RANK
92.3%
1 OR MORE VEHICLES IN HOUSEHOLD
99.9/ 100
METRIC RATING
38th/ 347
METRIC RANK
Immigrants from Belgium vs Immigrants from Vietnam 1 or more Vehicles in Household Correlation Chart
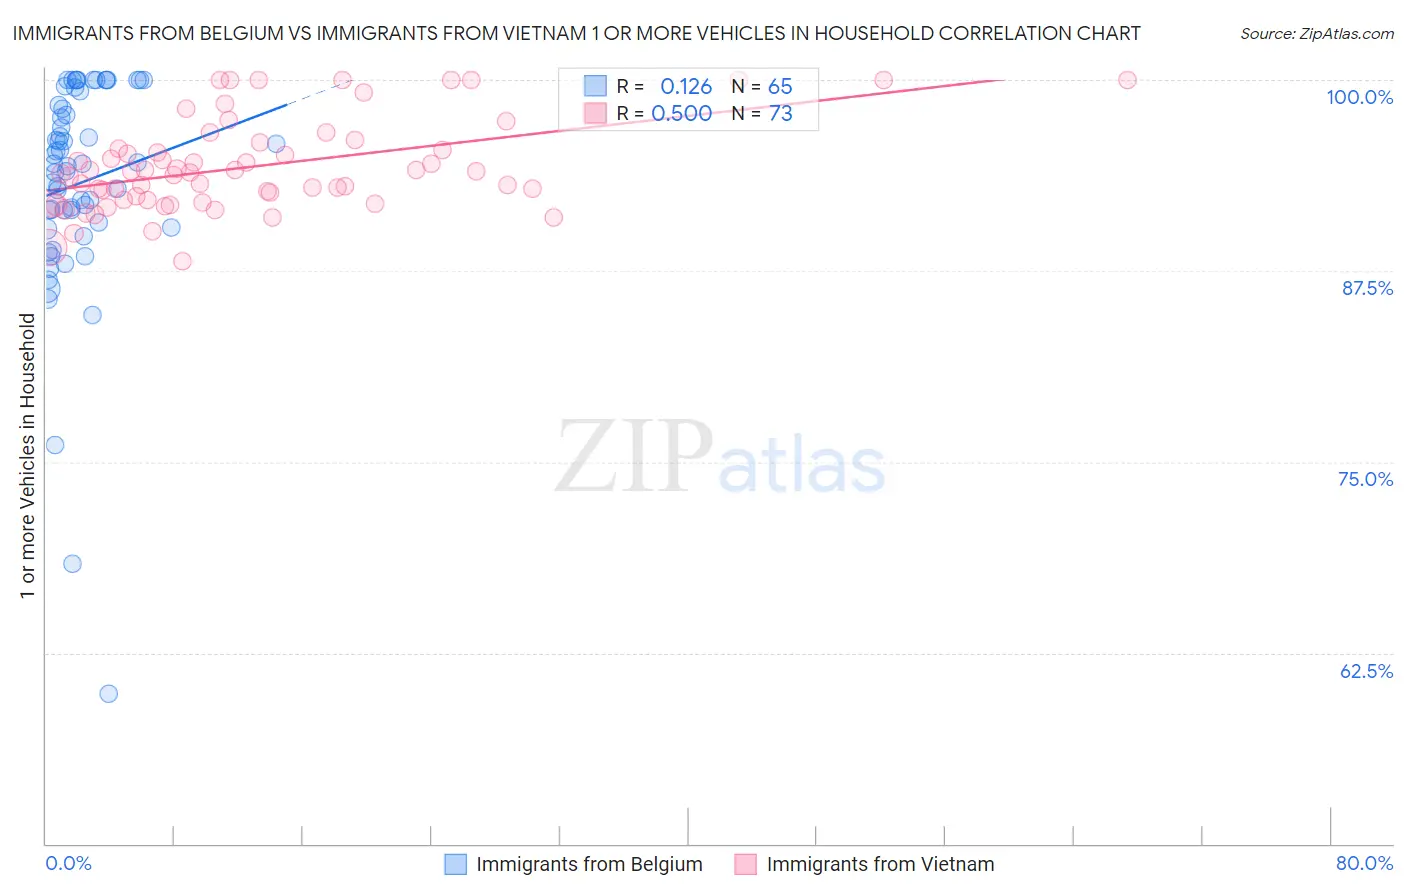
The statistical analysis conducted on geographies consisting of 146,691,899 people shows a poor positive correlation between the proportion of Immigrants from Belgium and percentage of households with 1 or more vehicles available in the United States with a correlation coefficient (R) of 0.126 and weighted average of 88.4%. Similarly, the statistical analysis conducted on geographies consisting of 404,601,572 people shows a substantial positive correlation between the proportion of Immigrants from Vietnam and percentage of households with 1 or more vehicles available in the United States with a correlation coefficient (R) of 0.500 and weighted average of 92.3%, a difference of 4.5%.
1 or more Vehicles in Household Correlation Summary
| Measurement | Immigrants from Belgium | Immigrants from Vietnam |
| Minimum | 59.8% | 88.1% |
| Maximum | 100.0% | 100.0% |
| Range | 40.2% | 11.9% |
| Mean | 93.2% | 94.3% |
| Median | 94.5% | 93.9% |
| Interquartile 25% (IQ1) | 90.5% | 92.1% |
| Interquartile 75% (IQ3) | 98.8% | 95.7% |
| Interquartile Range (IQR) | 8.4% | 3.6% |
| Standard Deviation (Sample) | 7.2% | 3.0% |
| Standard Deviation (Population) | 7.2% | 2.9% |
Similar Demographics by 1 or more Vehicles in Household
Demographics Similar to Immigrants from Belgium by 1 or more Vehicles in Household
In terms of 1 or more vehicles in household, the demographic groups most similar to Immigrants from Belgium are Immigrants from Portugal (88.3%, a difference of 0.020%), Immigrants from Czechoslovakia (88.3%, a difference of 0.040%), Menominee (88.3%, a difference of 0.050%), Turkish (88.4%, a difference of 0.060%), and Immigrants from Honduras (88.3%, a difference of 0.080%).
| Demographics | Rating | Rank | 1 or more Vehicles in Household |
| Immigrants | Pakistan | 4.5 /100 | #236 | Tragic 88.6% |
| Immigrants | Turkey | 4.4 /100 | #237 | Tragic 88.6% |
| Immigrants | Somalia | 4.2 /100 | #238 | Tragic 88.6% |
| Kiowa | 3.8 /100 | #239 | Tragic 88.6% |
| Eastern Europeans | 3.0 /100 | #240 | Tragic 88.5% |
| Taiwanese | 2.6 /100 | #241 | Tragic 88.4% |
| Turks | 2.5 /100 | #242 | Tragic 88.4% |
| Immigrants | Belgium | 2.1 /100 | #243 | Tragic 88.4% |
| Immigrants | Portugal | 2.0 /100 | #244 | Tragic 88.3% |
| Immigrants | Czechoslovakia | 1.9 /100 | #245 | Tragic 88.3% |
| Menominee | 1.9 /100 | #246 | Tragic 88.3% |
| Immigrants | Honduras | 1.7 /100 | #247 | Tragic 88.3% |
| Immigrants | Nigeria | 1.5 /100 | #248 | Tragic 88.2% |
| Blacks/African Americans | 1.4 /100 | #249 | Tragic 88.2% |
| Egyptians | 1.2 /100 | #250 | Tragic 88.2% |
Demographics Similar to Immigrants from Vietnam by 1 or more Vehicles in Household
In terms of 1 or more vehicles in household, the demographic groups most similar to Immigrants from Vietnam are French Canadian (92.3%, a difference of 0.0%), Malaysian (92.3%, a difference of 0.010%), Swiss (92.3%, a difference of 0.010%), Creek (92.3%, a difference of 0.010%), and Italian (92.3%, a difference of 0.020%).
| Demographics | Rating | Rank | 1 or more Vehicles in Household |
| Samoans | 100.0 /100 | #31 | Exceptional 92.4% |
| Basques | 100.0 /100 | #32 | Exceptional 92.4% |
| Cherokee | 100.0 /100 | #33 | Exceptional 92.4% |
| Italians | 99.9 /100 | #34 | Exceptional 92.3% |
| Czechoslovakians | 99.9 /100 | #35 | Exceptional 92.3% |
| Malaysians | 99.9 /100 | #36 | Exceptional 92.3% |
| French Canadians | 99.9 /100 | #37 | Exceptional 92.3% |
| Immigrants | Vietnam | 99.9 /100 | #38 | Exceptional 92.3% |
| Swiss | 99.9 /100 | #39 | Exceptional 92.3% |
| Creek | 99.9 /100 | #40 | Exceptional 92.3% |
| Immigrants | Taiwan | 99.9 /100 | #41 | Exceptional 92.3% |
| Chickasaw | 99.9 /100 | #42 | Exceptional 92.3% |
| Spanish | 99.9 /100 | #43 | Exceptional 92.3% |
| Choctaw | 99.9 /100 | #44 | Exceptional 92.2% |
| Immigrants | Nonimmigrants | 99.9 /100 | #45 | Exceptional 92.2% |