Immigrants from Belgium vs Immigrants from Fiji No Vehicles in Household
COMPARE
Immigrants from Belgium
Immigrants from Fiji
No Vehicles in Household
No Vehicles in Household Comparison
Immigrants from Belgium
Immigrants from Fiji
11.8%
NO VEHICLES IN HOUSEHOLD
1.9/ 100
METRIC RATING
248th/ 347
METRIC RANK
7.8%
NO VEHICLES IN HOUSEHOLD
99.9/ 100
METRIC RATING
39th/ 347
METRIC RANK
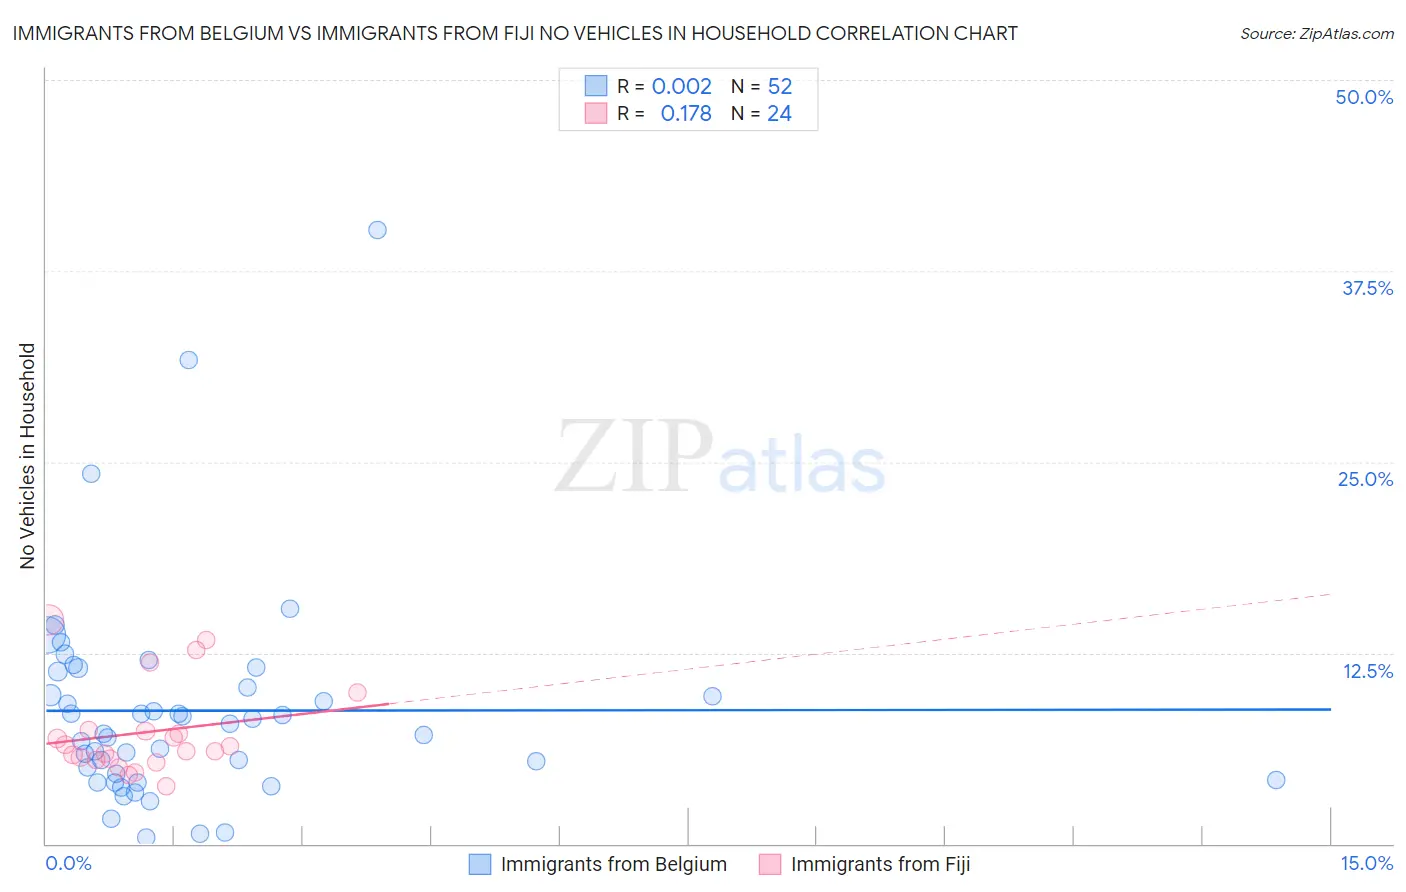
Immigrants from Belgium vs Immigrants from Fiji No Vehicles in Household Correlation Chart
The statistical analysis conducted on geographies consisting of 146,599,781 people shows no correlation between the proportion of Immigrants from Belgium and percentage of households with no vehicle available in the United States with a correlation coefficient (R) of 0.002 and weighted average of 11.8%. Similarly, the statistical analysis conducted on geographies consisting of 93,723,528 people shows a poor positive correlation between the proportion of Immigrants from Fiji and percentage of households with no vehicle available in the United States with a correlation coefficient (R) of 0.178 and weighted average of 7.8%, a difference of 50.7%.
No Vehicles in Household Correlation Summary
| Measurement | Immigrants from Belgium | Immigrants from Fiji |
| Minimum | 0.44% | 3.8% |
| Maximum | 40.2% | 14.7% |
| Range | 39.7% | 10.9% |
| Mean | 8.7% | 7.3% |
| Median | 7.5% | 6.2% |
| Interquartile 25% (IQ1) | 4.4% | 5.5% |
| Interquartile 75% (IQ3) | 10.8% | 7.4% |
| Interquartile Range (IQR) | 6.3% | 1.9% |
| Standard Deviation (Sample) | 7.0% | 3.0% |
| Standard Deviation (Population) | 7.0% | 2.9% |
Similar Demographics by No Vehicles in Household
Demographics Similar to Immigrants from Belgium by No Vehicles in Household
In terms of no vehicles in household, the demographic groups most similar to Immigrants from Belgium are Immigrants from Czechoslovakia (11.8%, a difference of 0.010%), Immigrants from Nigeria (11.8%, a difference of 0.030%), Menominee (11.8%, a difference of 0.060%), Immigrants from Honduras (11.8%, a difference of 0.23%), and Paiute (11.8%, a difference of 0.26%).
| Demographics | Rating | Rank | No Vehicles in Household |
| Eastern Europeans | 2.7 /100 | #241 | Tragic 11.7% |
| Turks | 2.6 /100 | #242 | Tragic 11.7% |
| Cheyenne | 2.4 /100 | #243 | Tragic 11.7% |
| Immigrants | Portugal | 2.2 /100 | #244 | Tragic 11.7% |
| Immigrants | Honduras | 2.1 /100 | #245 | Tragic 11.8% |
| Menominee | 2.0 /100 | #246 | Tragic 11.8% |
| Immigrants | Czechoslovakia | 2.0 /100 | #247 | Tragic 11.8% |
| Immigrants | Belgium | 1.9 /100 | #248 | Tragic 11.8% |
| Immigrants | Nigeria | 1.9 /100 | #249 | Tragic 11.8% |
| Paiute | 1.8 /100 | #250 | Tragic 11.8% |
| Blacks/African Americans | 1.6 /100 | #251 | Tragic 11.9% |
| Immigrants | Serbia | 1.5 /100 | #252 | Tragic 11.9% |
| Egyptians | 1.4 /100 | #253 | Tragic 11.9% |
| Immigrants | Uruguay | 1.3 /100 | #254 | Tragic 11.9% |
| Hondurans | 1.2 /100 | #255 | Tragic 12.0% |
Demographics Similar to Immigrants from Fiji by No Vehicles in Household
In terms of no vehicles in household, the demographic groups most similar to Immigrants from Fiji are Czechoslovakian (7.8%, a difference of 0.10%), French Canadian (7.8%, a difference of 0.24%), Swiss (7.9%, a difference of 0.38%), Chickasaw (7.9%, a difference of 0.46%), and Creek (7.8%, a difference of 0.58%).
| Demographics | Rating | Rank | No Vehicles in Household |
| Malaysians | 100.0 /100 | #32 | Exceptional 7.7% |
| Immigrants | Taiwan | 100.0 /100 | #33 | Exceptional 7.7% |
| Immigrants | Vietnam | 100.0 /100 | #34 | Exceptional 7.7% |
| Cherokee | 99.9 /100 | #35 | Exceptional 7.7% |
| Iraqis | 99.9 /100 | #36 | Exceptional 7.7% |
| Basques | 99.9 /100 | #37 | Exceptional 7.8% |
| Creek | 99.9 /100 | #38 | Exceptional 7.8% |
| Immigrants | Fiji | 99.9 /100 | #39 | Exceptional 7.8% |
| Czechoslovakians | 99.9 /100 | #40 | Exceptional 7.8% |
| French Canadians | 99.9 /100 | #41 | Exceptional 7.8% |
| Swiss | 99.9 /100 | #42 | Exceptional 7.9% |
| Chickasaw | 99.9 /100 | #43 | Exceptional 7.9% |
| Choctaw | 99.9 /100 | #44 | Exceptional 7.9% |
| Immigrants | Nonimmigrants | 99.9 /100 | #45 | Exceptional 7.9% |
| Spanish | 99.9 /100 | #46 | Exceptional 7.9% |