Immigrants from Belgium vs Immigrants from Romania No Vehicles in Household
COMPARE
Immigrants from Belgium
Immigrants from Romania
No Vehicles in Household
No Vehicles in Household Comparison
Immigrants from Belgium
Immigrants from Romania
11.8%
NO VEHICLES IN HOUSEHOLD
1.9/ 100
METRIC RATING
248th/ 347
METRIC RANK
11.4%
NO VEHICLES IN HOUSEHOLD
5.3/ 100
METRIC RATING
228th/ 347
METRIC RANK
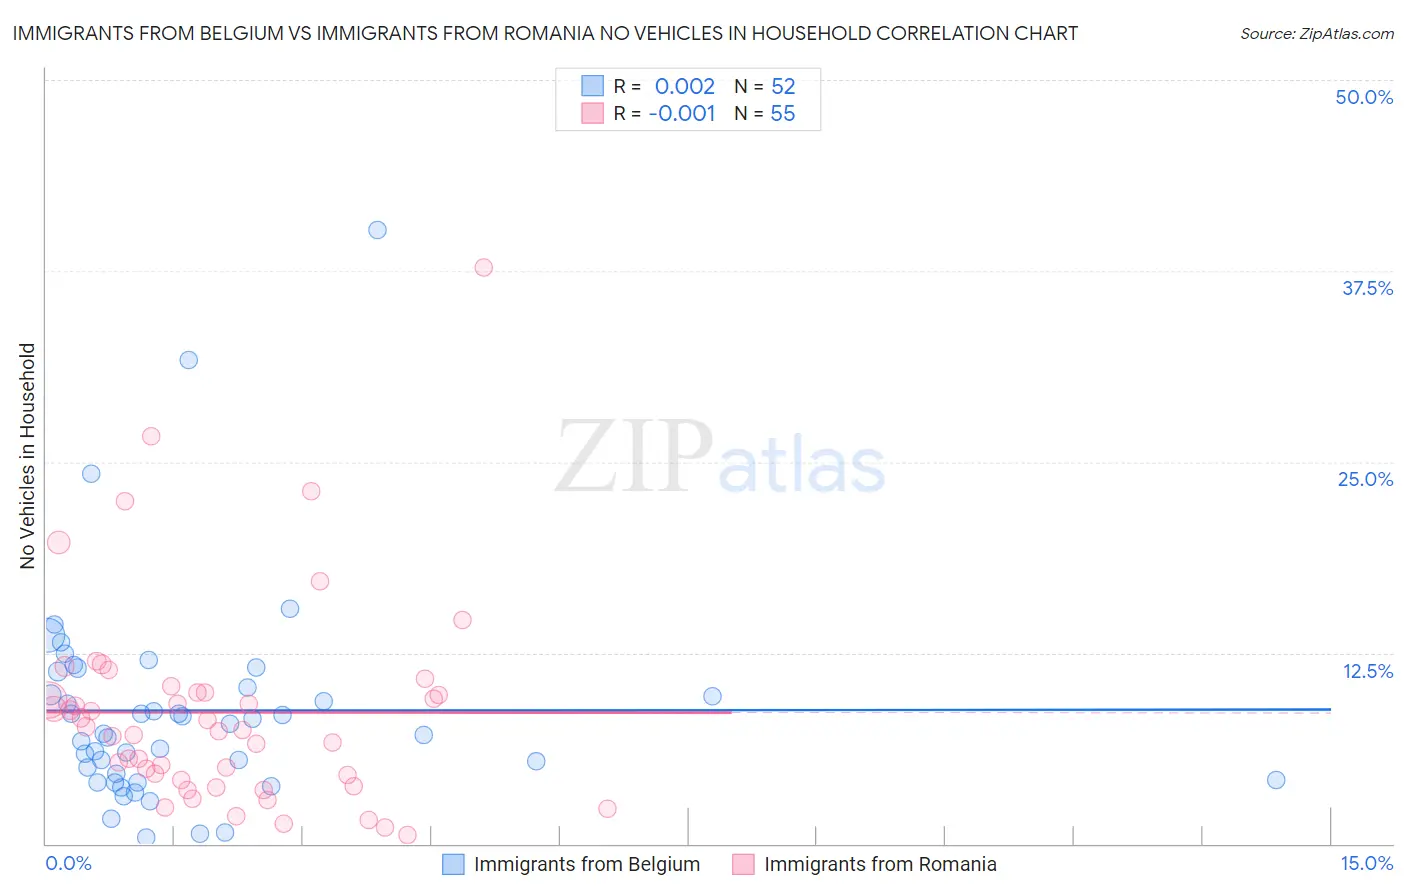
Immigrants from Belgium vs Immigrants from Romania No Vehicles in Household Correlation Chart
The statistical analysis conducted on geographies consisting of 146,599,781 people shows no correlation between the proportion of Immigrants from Belgium and percentage of households with no vehicle available in the United States with a correlation coefficient (R) of 0.002 and weighted average of 11.8%. Similarly, the statistical analysis conducted on geographies consisting of 256,713,633 people shows no correlation between the proportion of Immigrants from Romania and percentage of households with no vehicle available in the United States with a correlation coefficient (R) of -0.001 and weighted average of 11.4%, a difference of 3.2%.
No Vehicles in Household Correlation Summary
| Measurement | Immigrants from Belgium | Immigrants from Romania |
| Minimum | 0.44% | 0.55% |
| Maximum | 40.2% | 37.7% |
| Range | 39.7% | 37.2% |
| Mean | 8.7% | 8.6% |
| Median | 7.5% | 7.4% |
| Interquartile 25% (IQ1) | 4.4% | 4.2% |
| Interquartile 75% (IQ3) | 10.8% | 9.9% |
| Interquartile Range (IQR) | 6.3% | 5.8% |
| Standard Deviation (Sample) | 7.0% | 6.8% |
| Standard Deviation (Population) | 7.0% | 6.8% |
Demographics Similar to Immigrants from Belgium and Immigrants from Romania by No Vehicles in Household
In terms of no vehicles in household, the demographic groups most similar to Immigrants from Belgium are Immigrants from Czechoslovakia (11.8%, a difference of 0.010%), Menominee (11.8%, a difference of 0.060%), Immigrants from Honduras (11.8%, a difference of 0.23%), Immigrants from Portugal (11.7%, a difference of 0.42%), and Cheyenne (11.7%, a difference of 0.60%). Similarly, the demographic groups most similar to Immigrants from Romania are Ugandan (11.4%, a difference of 0.040%), Immigrants from Norway (11.4%, a difference of 0.16%), Immigrants from Japan (11.4%, a difference of 0.17%), Immigrants from Turkey (11.5%, a difference of 0.36%), and Houma (11.5%, a difference of 0.40%).
| Demographics | Rating | Rank | No Vehicles in Household |
| Immigrants | Romania | 5.3 /100 | #228 | Tragic 11.4% |
| Ugandans | 5.3 /100 | #229 | Tragic 11.4% |
| Immigrants | Norway | 5.1 /100 | #230 | Tragic 11.4% |
| Immigrants | Japan | 5.1 /100 | #231 | Tragic 11.4% |
| Immigrants | Turkey | 4.8 /100 | #232 | Tragic 11.5% |
| Houma | 4.7 /100 | #233 | Tragic 11.5% |
| Immigrants | Peru | 4.5 /100 | #234 | Tragic 11.5% |
| Kiowa | 4.0 /100 | #235 | Tragic 11.5% |
| Cree | 3.5 /100 | #236 | Tragic 11.6% |
| Ute | 3.3 /100 | #237 | Tragic 11.6% |
| Russians | 3.2 /100 | #238 | Tragic 11.6% |
| Taiwanese | 2.8 /100 | #239 | Tragic 11.7% |
| Immigrants | Immigrants | 2.7 /100 | #240 | Tragic 11.7% |
| Eastern Europeans | 2.7 /100 | #241 | Tragic 11.7% |
| Turks | 2.6 /100 | #242 | Tragic 11.7% |
| Cheyenne | 2.4 /100 | #243 | Tragic 11.7% |
| Immigrants | Portugal | 2.2 /100 | #244 | Tragic 11.7% |
| Immigrants | Honduras | 2.1 /100 | #245 | Tragic 11.8% |
| Menominee | 2.0 /100 | #246 | Tragic 11.8% |
| Immigrants | Czechoslovakia | 2.0 /100 | #247 | Tragic 11.8% |
| Immigrants | Belgium | 1.9 /100 | #248 | Tragic 11.8% |