Immigrants from Belgium vs Immigrants from Russia No Vehicles in Household
COMPARE
Immigrants from Belgium
Immigrants from Russia
No Vehicles in Household
No Vehicles in Household Comparison
Immigrants from Belgium
Immigrants from Russia
11.8%
NO VEHICLES IN HOUSEHOLD
1.9/ 100
METRIC RATING
248th/ 347
METRIC RANK
15.1%
NO VEHICLES IN HOUSEHOLD
0.0/ 100
METRIC RATING
304th/ 347
METRIC RANK
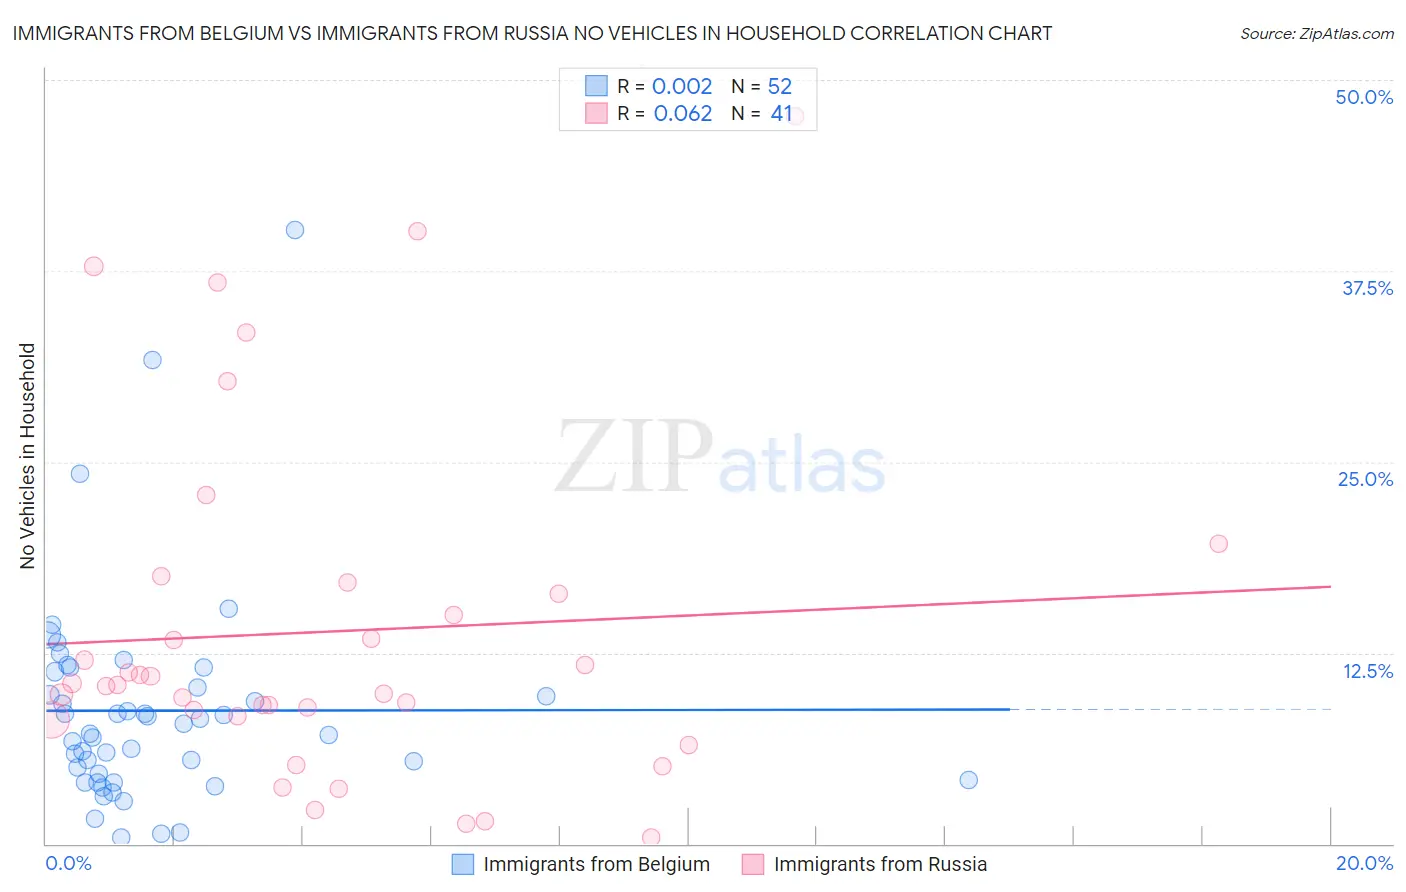
Immigrants from Belgium vs Immigrants from Russia No Vehicles in Household Correlation Chart
The statistical analysis conducted on geographies consisting of 146,599,781 people shows no correlation between the proportion of Immigrants from Belgium and percentage of households with no vehicle available in the United States with a correlation coefficient (R) of 0.002 and weighted average of 11.8%. Similarly, the statistical analysis conducted on geographies consisting of 347,176,226 people shows a slight positive correlation between the proportion of Immigrants from Russia and percentage of households with no vehicle available in the United States with a correlation coefficient (R) of 0.062 and weighted average of 15.1%, a difference of 28.1%.
No Vehicles in Household Correlation Summary
| Measurement | Immigrants from Belgium | Immigrants from Russia |
| Minimum | 0.44% | 0.41% |
| Maximum | 40.2% | 47.6% |
| Range | 39.7% | 47.2% |
| Mean | 8.7% | 13.9% |
| Median | 7.5% | 10.4% |
| Interquartile 25% (IQ1) | 4.4% | 8.3% |
| Interquartile 75% (IQ3) | 10.8% | 16.7% |
| Interquartile Range (IQR) | 6.3% | 8.5% |
| Standard Deviation (Sample) | 7.0% | 11.3% |
| Standard Deviation (Population) | 7.0% | 11.1% |
Similar Demographics by No Vehicles in Household
Demographics Similar to Immigrants from Belgium by No Vehicles in Household
In terms of no vehicles in household, the demographic groups most similar to Immigrants from Belgium are Immigrants from Czechoslovakia (11.8%, a difference of 0.010%), Immigrants from Nigeria (11.8%, a difference of 0.030%), Menominee (11.8%, a difference of 0.060%), Immigrants from Honduras (11.8%, a difference of 0.23%), and Paiute (11.8%, a difference of 0.26%).
| Demographics | Rating | Rank | No Vehicles in Household |
| Eastern Europeans | 2.7 /100 | #241 | Tragic 11.7% |
| Turks | 2.6 /100 | #242 | Tragic 11.7% |
| Cheyenne | 2.4 /100 | #243 | Tragic 11.7% |
| Immigrants | Portugal | 2.2 /100 | #244 | Tragic 11.7% |
| Immigrants | Honduras | 2.1 /100 | #245 | Tragic 11.8% |
| Menominee | 2.0 /100 | #246 | Tragic 11.8% |
| Immigrants | Czechoslovakia | 2.0 /100 | #247 | Tragic 11.8% |
| Immigrants | Belgium | 1.9 /100 | #248 | Tragic 11.8% |
| Immigrants | Nigeria | 1.9 /100 | #249 | Tragic 11.8% |
| Paiute | 1.8 /100 | #250 | Tragic 11.8% |
| Blacks/African Americans | 1.6 /100 | #251 | Tragic 11.9% |
| Immigrants | Serbia | 1.5 /100 | #252 | Tragic 11.9% |
| Egyptians | 1.4 /100 | #253 | Tragic 11.9% |
| Immigrants | Uruguay | 1.3 /100 | #254 | Tragic 11.9% |
| Hondurans | 1.2 /100 | #255 | Tragic 12.0% |
Demographics Similar to Immigrants from Russia by No Vehicles in Household
In terms of no vehicles in household, the demographic groups most similar to Immigrants from Russia are Immigrants from China (15.2%, a difference of 0.38%), Immigrants from Western Africa (15.0%, a difference of 0.66%), Haitian (14.9%, a difference of 1.2%), Immigrants from Ukraine (14.9%, a difference of 1.7%), and Yuman (14.9%, a difference of 1.7%).
| Demographics | Rating | Rank | No Vehicles in Household |
| Immigrants | Panama | 0.0 /100 | #297 | Tragic 14.6% |
| Moroccans | 0.0 /100 | #298 | Tragic 14.7% |
| Immigrants | Greece | 0.0 /100 | #299 | Tragic 14.7% |
| Yuman | 0.0 /100 | #300 | Tragic 14.9% |
| Immigrants | Ukraine | 0.0 /100 | #301 | Tragic 14.9% |
| Haitians | 0.0 /100 | #302 | Tragic 14.9% |
| Immigrants | Western Africa | 0.0 /100 | #303 | Tragic 15.0% |
| Immigrants | Russia | 0.0 /100 | #304 | Tragic 15.1% |
| Immigrants | China | 0.0 /100 | #305 | Tragic 15.2% |
| Immigrants | Belize | 0.0 /100 | #306 | Tragic 15.4% |
| Immigrants | Haiti | 0.0 /100 | #307 | Tragic 15.4% |
| U.S. Virgin Islanders | 0.0 /100 | #308 | Tragic 15.4% |
| Puerto Ricans | 0.0 /100 | #309 | Tragic 15.5% |
| Cape Verdeans | 0.0 /100 | #310 | Tragic 15.6% |
| Immigrants | Israel | 0.0 /100 | #311 | Tragic 15.6% |