Immigrants from Belgium vs Immigrants from Africa No Vehicles in Household
COMPARE
Immigrants from Belgium
Immigrants from Africa
No Vehicles in Household
No Vehicles in Household Comparison
Immigrants from Belgium
Immigrants from Africa
11.8%
NO VEHICLES IN HOUSEHOLD
1.9/ 100
METRIC RATING
248th/ 347
METRIC RANK
12.5%
NO VEHICLES IN HOUSEHOLD
0.2/ 100
METRIC RATING
268th/ 347
METRIC RANK
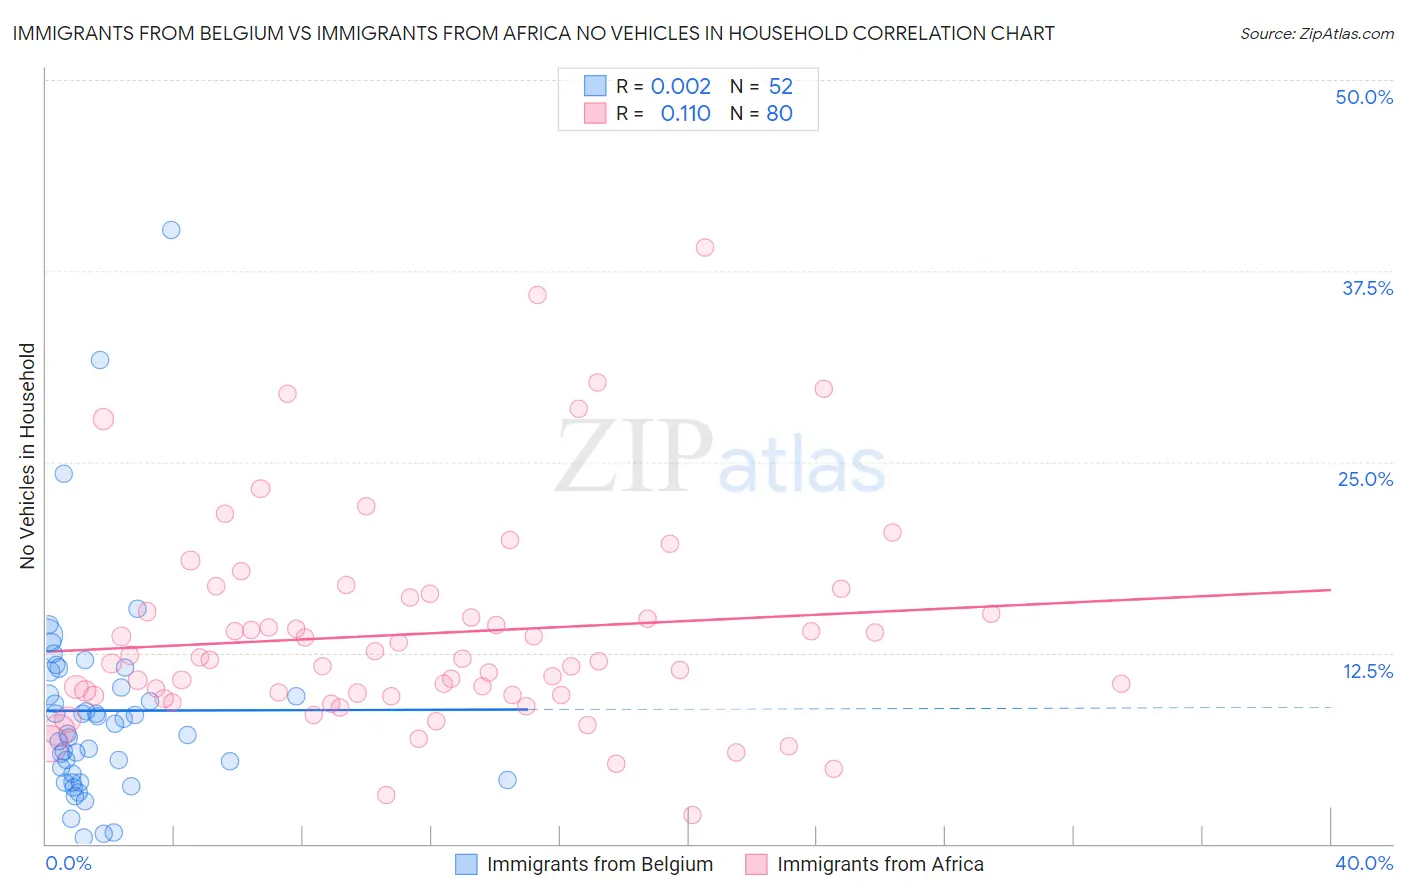
Immigrants from Belgium vs Immigrants from Africa No Vehicles in Household Correlation Chart
The statistical analysis conducted on geographies consisting of 146,599,781 people shows no correlation between the proportion of Immigrants from Belgium and percentage of households with no vehicle available in the United States with a correlation coefficient (R) of 0.002 and weighted average of 11.8%. Similarly, the statistical analysis conducted on geographies consisting of 467,696,896 people shows a poor positive correlation between the proportion of Immigrants from Africa and percentage of households with no vehicle available in the United States with a correlation coefficient (R) of 0.110 and weighted average of 12.5%, a difference of 6.2%.
No Vehicles in Household Correlation Summary
| Measurement | Immigrants from Belgium | Immigrants from Africa |
| Minimum | 0.44% | 1.9% |
| Maximum | 40.2% | 39.1% |
| Range | 39.7% | 37.2% |
| Mean | 8.7% | 13.7% |
| Median | 7.5% | 12.0% |
| Interquartile 25% (IQ1) | 4.4% | 9.7% |
| Interquartile 75% (IQ3) | 10.8% | 15.7% |
| Interquartile Range (IQR) | 6.3% | 6.0% |
| Standard Deviation (Sample) | 7.0% | 7.0% |
| Standard Deviation (Population) | 7.0% | 7.0% |
Demographics Similar to Immigrants from Belgium and Immigrants from Africa by No Vehicles in Household
In terms of no vehicles in household, the demographic groups most similar to Immigrants from Belgium are Immigrants from Nigeria (11.8%, a difference of 0.030%), Paiute (11.8%, a difference of 0.26%), Black/African American (11.9%, a difference of 0.60%), Immigrants from Serbia (11.9%, a difference of 0.86%), and Egyptian (11.9%, a difference of 0.93%). Similarly, the demographic groups most similar to Immigrants from Africa are Immigrants from Europe (12.5%, a difference of 0.050%), Israeli (12.4%, a difference of 0.63%), African (12.3%, a difference of 1.6%), Immigrants from Switzerland (12.3%, a difference of 1.8%), and Immigrants from Egypt (12.2%, a difference of 2.3%).
| Demographics | Rating | Rank | No Vehicles in Household |
| Immigrants | Belgium | 1.9 /100 | #248 | Tragic 11.8% |
| Immigrants | Nigeria | 1.9 /100 | #249 | Tragic 11.8% |
| Paiute | 1.8 /100 | #250 | Tragic 11.8% |
| Blacks/African Americans | 1.6 /100 | #251 | Tragic 11.9% |
| Immigrants | Serbia | 1.5 /100 | #252 | Tragic 11.9% |
| Egyptians | 1.4 /100 | #253 | Tragic 11.9% |
| Immigrants | Uruguay | 1.3 /100 | #254 | Tragic 11.9% |
| Hondurans | 1.2 /100 | #255 | Tragic 12.0% |
| Liberians | 1.2 /100 | #256 | Tragic 12.0% |
| Nigerians | 0.9 /100 | #257 | Tragic 12.1% |
| South American Indians | 0.9 /100 | #258 | Tragic 12.1% |
| Immigrants | Latvia | 0.8 /100 | #259 | Tragic 12.1% |
| Macedonians | 0.7 /100 | #260 | Tragic 12.2% |
| Sub-Saharan Africans | 0.6 /100 | #261 | Tragic 12.2% |
| Immigrants | Liberia | 0.6 /100 | #262 | Tragic 12.2% |
| Immigrants | Egypt | 0.6 /100 | #263 | Tragic 12.2% |
| Immigrants | Switzerland | 0.5 /100 | #264 | Tragic 12.3% |
| Africans | 0.4 /100 | #265 | Tragic 12.3% |
| Israelis | 0.3 /100 | #266 | Tragic 12.4% |
| Immigrants | Europe | 0.3 /100 | #267 | Tragic 12.5% |
| Immigrants | Africa | 0.2 /100 | #268 | Tragic 12.5% |