Immigrants from Belarus vs Immigrants from Egypt No Vehicles in Household
COMPARE
Immigrants from Belarus
Immigrants from Egypt
No Vehicles in Household
No Vehicles in Household Comparison
Immigrants from Belarus
Immigrants from Egypt
16.7%
NO VEHICLES IN HOUSEHOLD
0.0/ 100
METRIC RATING
318th/ 347
METRIC RANK
12.2%
NO VEHICLES IN HOUSEHOLD
0.6/ 100
METRIC RATING
263rd/ 347
METRIC RANK
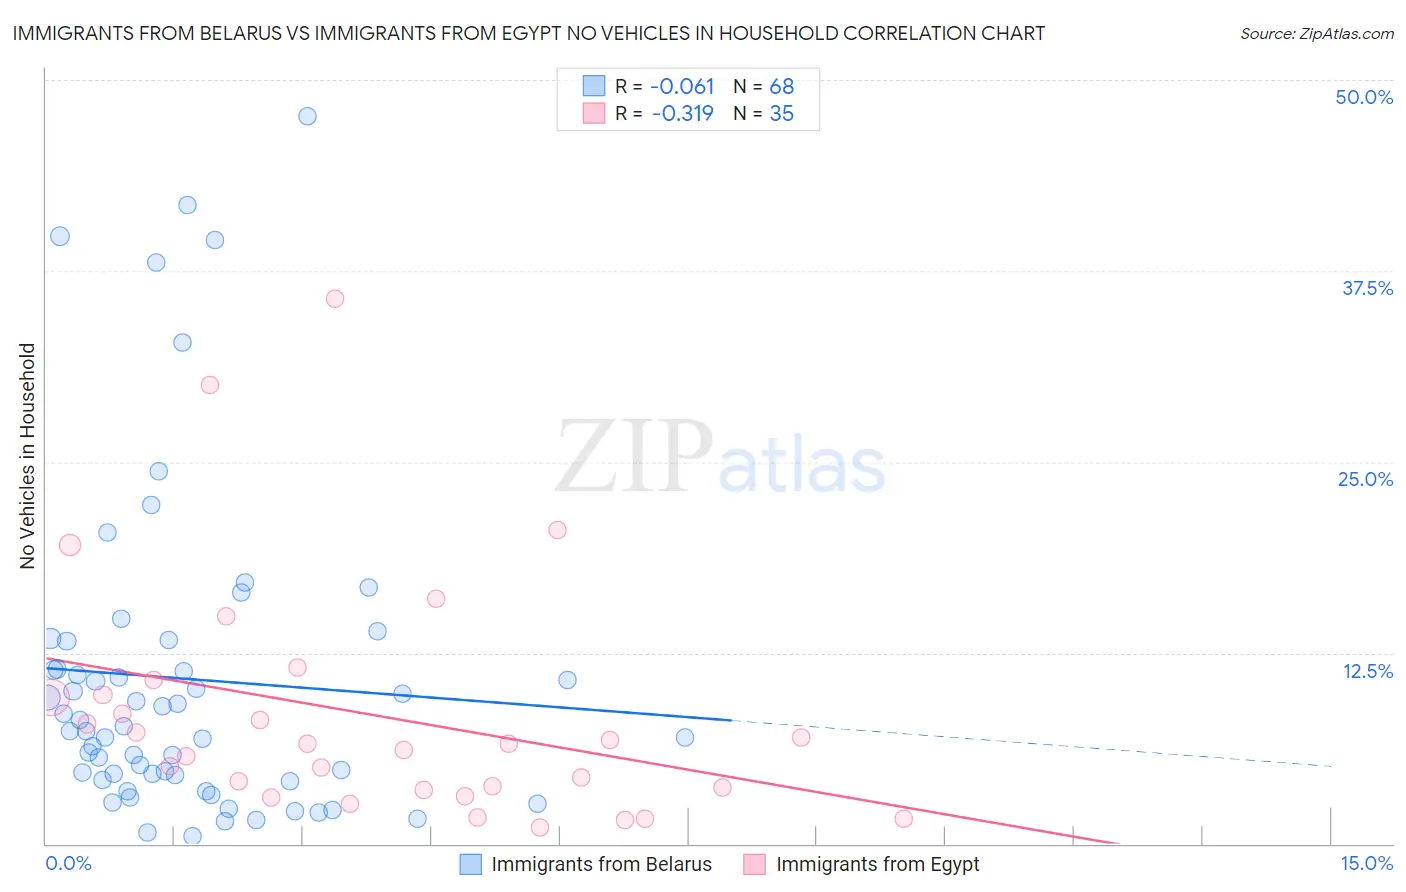
Immigrants from Belarus vs Immigrants from Egypt No Vehicles in Household Correlation Chart
The statistical analysis conducted on geographies consisting of 150,031,652 people shows a slight negative correlation between the proportion of Immigrants from Belarus and percentage of households with no vehicle available in the United States with a correlation coefficient (R) of -0.061 and weighted average of 16.7%. Similarly, the statistical analysis conducted on geographies consisting of 245,144,275 people shows a mild negative correlation between the proportion of Immigrants from Egypt and percentage of households with no vehicle available in the United States with a correlation coefficient (R) of -0.319 and weighted average of 12.2%, a difference of 36.9%.
No Vehicles in Household Correlation Summary
| Measurement | Immigrants from Belarus | Immigrants from Egypt |
| Minimum | 0.49% | 1.1% |
| Maximum | 47.6% | 35.7% |
| Range | 47.1% | 34.6% |
| Mean | 10.8% | 8.4% |
| Median | 7.5% | 6.5% |
| Interquartile 25% (IQ1) | 4.3% | 3.6% |
| Interquartile 75% (IQ3) | 12.4% | 9.7% |
| Interquartile Range (IQR) | 8.0% | 6.2% |
| Standard Deviation (Sample) | 10.5% | 7.8% |
| Standard Deviation (Population) | 10.5% | 7.7% |
Similar Demographics by No Vehicles in Household
Demographics Similar to Immigrants from Belarus by No Vehicles in Household
In terms of no vehicles in household, the demographic groups most similar to Immigrants from Belarus are Immigrants from Ghana (16.6%, a difference of 0.86%), Ghanaian (16.4%, a difference of 1.8%), Alaska Native (17.4%, a difference of 3.9%), Soviet Union (17.4%, a difference of 4.1%), and Cypriot (15.7%, a difference of 6.9%).
| Demographics | Rating | Rank | No Vehicles in Household |
| Immigrants | Israel | 0.0 /100 | #311 | Tragic 15.6% |
| Alaskan Athabascans | 0.0 /100 | #312 | Tragic 15.6% |
| Tohono O'odham | 0.0 /100 | #313 | Tragic 15.6% |
| Albanians | 0.0 /100 | #314 | Tragic 15.6% |
| Cypriots | 0.0 /100 | #315 | Tragic 15.7% |
| Ghanaians | 0.0 /100 | #316 | Tragic 16.4% |
| Immigrants | Ghana | 0.0 /100 | #317 | Tragic 16.6% |
| Immigrants | Belarus | 0.0 /100 | #318 | Tragic 16.7% |
| Alaska Natives | 0.0 /100 | #319 | Tragic 17.4% |
| Soviet Union | 0.0 /100 | #320 | Tragic 17.4% |
| Jamaicans | 0.0 /100 | #321 | Tragic 17.9% |
| Immigrants | Cabo Verde | 0.0 /100 | #322 | Tragic 18.4% |
| Immigrants | Yemen | 0.0 /100 | #323 | Tragic 19.5% |
| Immigrants | Caribbean | 0.0 /100 | #324 | Tragic 19.6% |
| Senegalese | 0.0 /100 | #325 | Tragic 19.8% |
Demographics Similar to Immigrants from Egypt by No Vehicles in Household
In terms of no vehicles in household, the demographic groups most similar to Immigrants from Egypt are Immigrants from Liberia (12.2%, a difference of 0.15%), Subsaharan African (12.2%, a difference of 0.22%), Immigrants from Switzerland (12.3%, a difference of 0.46%), Macedonian (12.2%, a difference of 0.61%), and African (12.3%, a difference of 0.71%).
| Demographics | Rating | Rank | No Vehicles in Household |
| Liberians | 1.2 /100 | #256 | Tragic 12.0% |
| Nigerians | 0.9 /100 | #257 | Tragic 12.1% |
| South American Indians | 0.9 /100 | #258 | Tragic 12.1% |
| Immigrants | Latvia | 0.8 /100 | #259 | Tragic 12.1% |
| Macedonians | 0.7 /100 | #260 | Tragic 12.2% |
| Sub-Saharan Africans | 0.6 /100 | #261 | Tragic 12.2% |
| Immigrants | Liberia | 0.6 /100 | #262 | Tragic 12.2% |
| Immigrants | Egypt | 0.6 /100 | #263 | Tragic 12.2% |
| Immigrants | Switzerland | 0.5 /100 | #264 | Tragic 12.3% |
| Africans | 0.4 /100 | #265 | Tragic 12.3% |
| Israelis | 0.3 /100 | #266 | Tragic 12.4% |
| Immigrants | Europe | 0.3 /100 | #267 | Tragic 12.5% |
| Immigrants | Africa | 0.2 /100 | #268 | Tragic 12.5% |
| Panamanians | 0.2 /100 | #269 | Tragic 12.5% |
| Immigrants | Northern Africa | 0.2 /100 | #270 | Tragic 12.6% |