Immigrants from Belarus vs Guyanese No Vehicles in Household
COMPARE
Immigrants from Belarus
Guyanese
No Vehicles in Household
No Vehicles in Household Comparison
Immigrants from Belarus
Guyanese
16.7%
NO VEHICLES IN HOUSEHOLD
0.0/ 100
METRIC RATING
318th/ 347
METRIC RANK
29.3%
NO VEHICLES IN HOUSEHOLD
0.0/ 100
METRIC RATING
338th/ 347
METRIC RANK
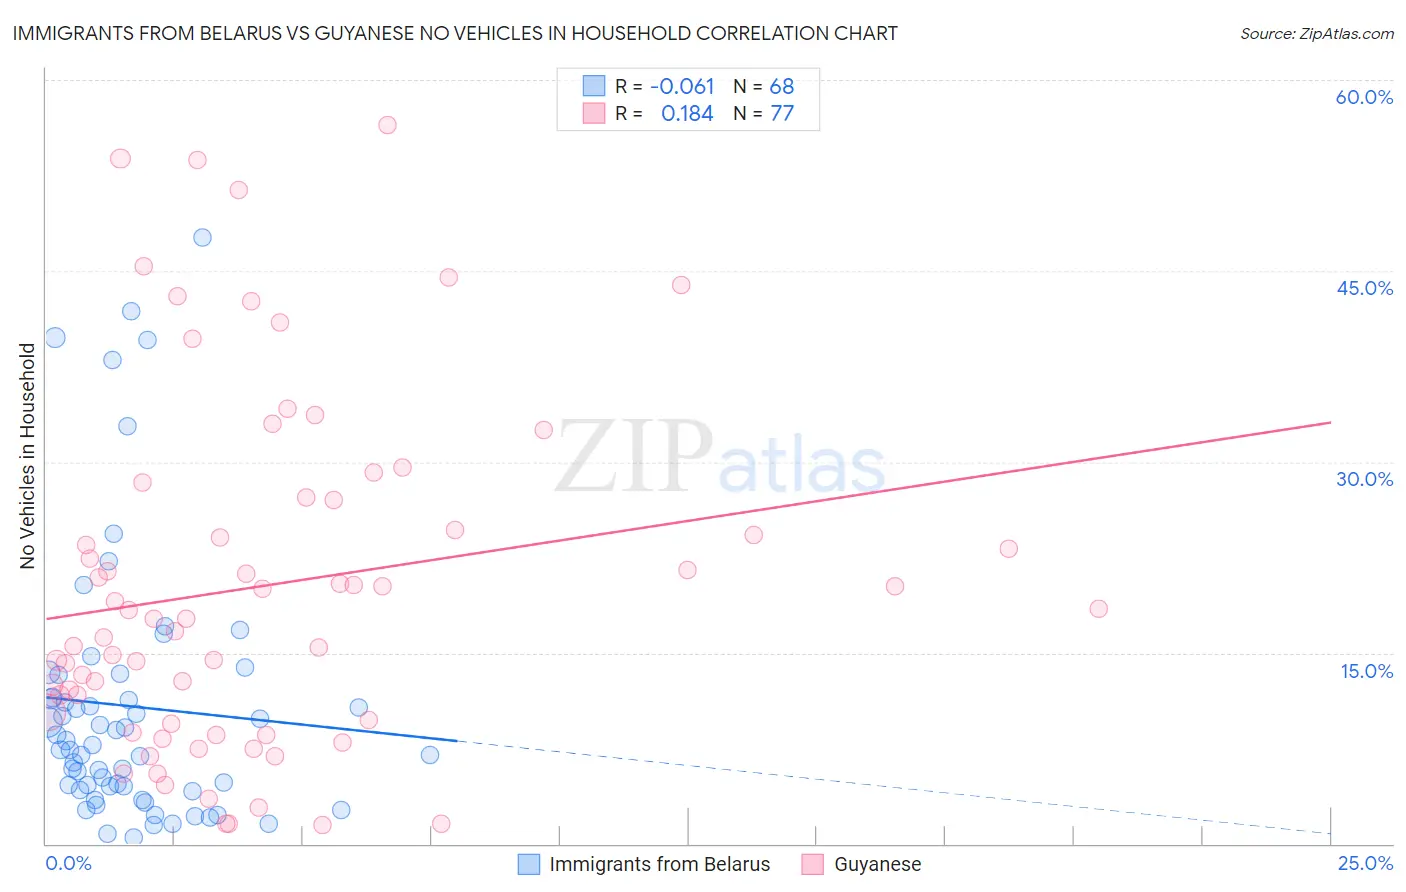
Immigrants from Belarus vs Guyanese No Vehicles in Household Correlation Chart
The statistical analysis conducted on geographies consisting of 150,031,652 people shows a slight negative correlation between the proportion of Immigrants from Belarus and percentage of households with no vehicle available in the United States with a correlation coefficient (R) of -0.061 and weighted average of 16.7%. Similarly, the statistical analysis conducted on geographies consisting of 176,563,698 people shows a poor positive correlation between the proportion of Guyanese and percentage of households with no vehicle available in the United States with a correlation coefficient (R) of 0.184 and weighted average of 29.3%, a difference of 75.0%.
No Vehicles in Household Correlation Summary
| Measurement | Immigrants from Belarus | Guyanese |
| Minimum | 0.49% | 1.4% |
| Maximum | 47.6% | 56.4% |
| Range | 47.1% | 55.0% |
| Mean | 10.8% | 20.3% |
| Median | 7.5% | 17.7% |
| Interquartile 25% (IQ1) | 4.3% | 9.6% |
| Interquartile 75% (IQ3) | 12.4% | 27.1% |
| Interquartile Range (IQR) | 8.0% | 17.6% |
| Standard Deviation (Sample) | 10.5% | 13.7% |
| Standard Deviation (Population) | 10.5% | 13.6% |
Demographics Similar to Immigrants from Belarus and Guyanese by No Vehicles in Household
In terms of no vehicles in household, the demographic groups most similar to Immigrants from Belarus are Alaska Native (17.4%, a difference of 3.9%), Soviet Union (17.4%, a difference of 4.1%), Jamaican (17.9%, a difference of 7.1%), Immigrants from Cabo Verde (18.4%, a difference of 10.2%), and Immigrants from Yemen (19.5%, a difference of 16.3%). Similarly, the demographic groups most similar to Guyanese are Immigrants from Uzbekistan (26.7%, a difference of 9.9%), Vietnamese (26.2%, a difference of 11.7%), Barbadian (26.1%, a difference of 12.3%), Immigrants from Bangladesh (25.8%, a difference of 13.8%), and Immigrants from Trinidad and Tobago (24.6%, a difference of 19.0%).
| Demographics | Rating | Rank | No Vehicles in Household |
| Immigrants | Belarus | 0.0 /100 | #318 | Tragic 16.7% |
| Alaska Natives | 0.0 /100 | #319 | Tragic 17.4% |
| Soviet Union | 0.0 /100 | #320 | Tragic 17.4% |
| Jamaicans | 0.0 /100 | #321 | Tragic 17.9% |
| Immigrants | Cabo Verde | 0.0 /100 | #322 | Tragic 18.4% |
| Immigrants | Yemen | 0.0 /100 | #323 | Tragic 19.5% |
| Immigrants | Caribbean | 0.0 /100 | #324 | Tragic 19.6% |
| Senegalese | 0.0 /100 | #325 | Tragic 19.8% |
| Immigrants | West Indies | 0.0 /100 | #326 | Tragic 20.5% |
| Immigrants | Senegal | 0.0 /100 | #327 | Tragic 21.1% |
| Immigrants | Dominica | 0.0 /100 | #328 | Tragic 22.2% |
| Ecuadorians | 0.0 /100 | #329 | Tragic 22.8% |
| West Indians | 0.0 /100 | #330 | Tragic 23.7% |
| Trinidadians and Tobagonians | 0.0 /100 | #331 | Tragic 23.7% |
| Immigrants | Ecuador | 0.0 /100 | #332 | Tragic 23.8% |
| Immigrants | Trinidad and Tobago | 0.0 /100 | #333 | Tragic 24.6% |
| Immigrants | Bangladesh | 0.0 /100 | #334 | Tragic 25.8% |
| Barbadians | 0.0 /100 | #335 | Tragic 26.1% |
| Vietnamese | 0.0 /100 | #336 | Tragic 26.2% |
| Immigrants | Uzbekistan | 0.0 /100 | #337 | Tragic 26.7% |
| Guyanese | 0.0 /100 | #338 | Tragic 29.3% |