Immigrants from Australia vs Uruguayan 4 or more Vehicles in Household
COMPARE
Immigrants from Australia
Uruguayan
4 or more Vehicles in Household
4 or more Vehicles in Household Comparison
Immigrants from Australia
Uruguayans
5.8%
4 OR MORE VEHICLES IN HOUSEHOLD
3.8/ 100
METRIC RATING
239th/ 347
METRIC RANK
5.6%
4 OR MORE VEHICLES IN HOUSEHOLD
1.3/ 100
METRIC RATING
260th/ 347
METRIC RANK
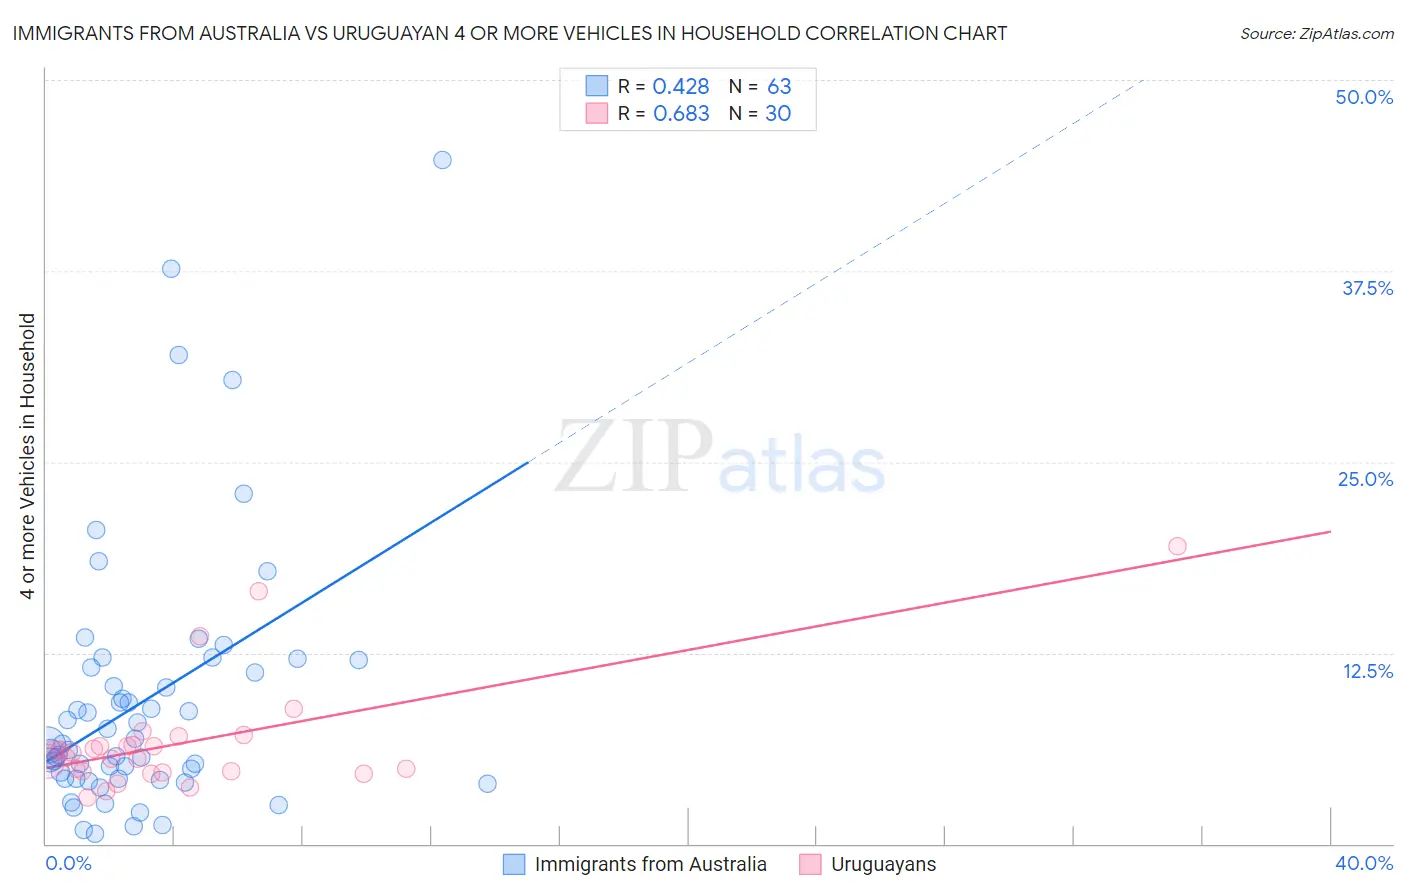
Immigrants from Australia vs Uruguayan 4 or more Vehicles in Household Correlation Chart
The statistical analysis conducted on geographies consisting of 226,216,978 people shows a moderate positive correlation between the proportion of Immigrants from Australia and percentage of households with 4 or more vehicles available in the United States with a correlation coefficient (R) of 0.428 and weighted average of 5.8%. Similarly, the statistical analysis conducted on geographies consisting of 144,399,753 people shows a significant positive correlation between the proportion of Uruguayans and percentage of households with 4 or more vehicles available in the United States with a correlation coefficient (R) of 0.683 and weighted average of 5.6%, a difference of 3.2%.
4 or more Vehicles in Household Correlation Summary
| Measurement | Immigrants from Australia | Uruguayan |
| Minimum | 0.65% | 3.1% |
| Maximum | 44.7% | 19.5% |
| Range | 44.1% | 16.5% |
| Mean | 9.3% | 6.7% |
| Median | 6.5% | 5.8% |
| Interquartile 25% (IQ1) | 4.2% | 4.7% |
| Interquartile 75% (IQ3) | 11.6% | 6.5% |
| Interquartile Range (IQR) | 7.3% | 1.7% |
| Standard Deviation (Sample) | 8.6% | 3.7% |
| Standard Deviation (Population) | 8.5% | 3.6% |
Similar Demographics by 4 or more Vehicles in Household
Demographics Similar to Immigrants from Australia by 4 or more Vehicles in Household
In terms of 4 or more vehicles in household, the demographic groups most similar to Immigrants from Australia are Immigrants from Poland (5.8%, a difference of 0.040%), Immigrants from Belgium (5.8%, a difference of 0.090%), Mongolian (5.8%, a difference of 0.14%), Turkish (5.8%, a difference of 0.22%), and Immigrants from Middle Africa (5.8%, a difference of 0.35%).
| Demographics | Rating | Rank | 4 or more Vehicles in Household |
| Immigrants | Argentina | 6.0 /100 | #232 | Tragic 5.9% |
| Sierra Leoneans | 6.0 /100 | #233 | Tragic 5.9% |
| Africans | 4.6 /100 | #234 | Tragic 5.8% |
| Immigrants | Hungary | 4.6 /100 | #235 | Tragic 5.8% |
| Immigrants | Eritrea | 4.5 /100 | #236 | Tragic 5.8% |
| Turks | 4.1 /100 | #237 | Tragic 5.8% |
| Immigrants | Belgium | 4.0 /100 | #238 | Tragic 5.8% |
| Immigrants | Australia | 3.8 /100 | #239 | Tragic 5.8% |
| Immigrants | Poland | 3.8 /100 | #240 | Tragic 5.8% |
| Mongolians | 3.7 /100 | #241 | Tragic 5.8% |
| Immigrants | Middle Africa | 3.4 /100 | #242 | Tragic 5.8% |
| Immigrants | Czechoslovakia | 3.2 /100 | #243 | Tragic 5.8% |
| Ethiopians | 3.2 /100 | #244 | Tragic 5.8% |
| Bulgarians | 3.1 /100 | #245 | Tragic 5.8% |
| Immigrants | North Macedonia | 2.5 /100 | #246 | Tragic 5.7% |
Demographics Similar to Uruguayans by 4 or more Vehicles in Household
In terms of 4 or more vehicles in household, the demographic groups most similar to Uruguayans are Sudanese (5.6%, a difference of 0.090%), Immigrants from France (5.6%, a difference of 0.18%), Bermudan (5.6%, a difference of 0.20%), Immigrants from Lithuania (5.6%, a difference of 0.22%), and Immigrants from Saudi Arabia (5.6%, a difference of 0.29%).
| Demographics | Rating | Rank | 4 or more Vehicles in Household |
| Immigrants | Cuba | 1.6 /100 | #253 | Tragic 5.7% |
| Immigrants | Panama | 1.5 /100 | #254 | Tragic 5.7% |
| Yup'ik | 1.5 /100 | #255 | Tragic 5.7% |
| Immigrants | Turkey | 1.5 /100 | #256 | Tragic 5.7% |
| Immigrants | Northern Africa | 1.4 /100 | #257 | Tragic 5.6% |
| Immigrants | Lithuania | 1.4 /100 | #258 | Tragic 5.6% |
| Immigrants | France | 1.3 /100 | #259 | Tragic 5.6% |
| Uruguayans | 1.3 /100 | #260 | Tragic 5.6% |
| Sudanese | 1.2 /100 | #261 | Tragic 5.6% |
| Bermudans | 1.2 /100 | #262 | Tragic 5.6% |
| Immigrants | Saudi Arabia | 1.1 /100 | #263 | Tragic 5.6% |
| Immigrants | Africa | 1.0 /100 | #264 | Tragic 5.6% |
| South Americans | 0.9 /100 | #265 | Tragic 5.6% |
| Immigrants | Nepal | 0.9 /100 | #266 | Tragic 5.6% |
| Immigrants | Ukraine | 0.9 /100 | #267 | Tragic 5.6% |