Immigrants from Australia vs Malaysian Currently Married
COMPARE
Immigrants from Australia
Malaysian
Currently Married
Currently Married Comparison
Immigrants from Australia
Malaysians
47.3%
CURRENTLY MARRIED
81.1/ 100
METRIC RATING
134th/ 347
METRIC RANK
45.9%
CURRENTLY MARRIED
15.3/ 100
METRIC RATING
201st/ 347
METRIC RANK
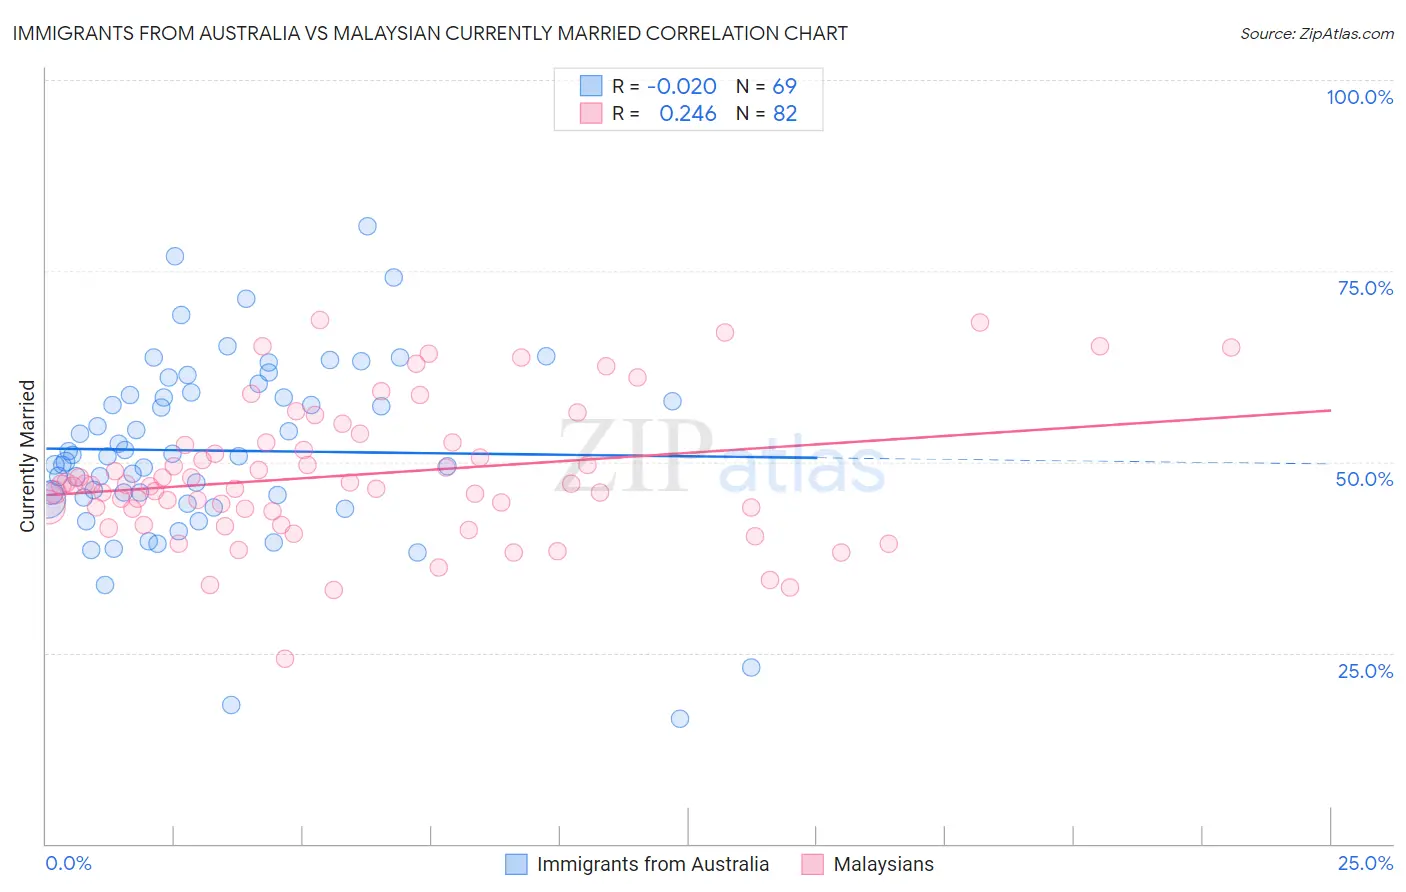
Immigrants from Australia vs Malaysian Currently Married Correlation Chart
The statistical analysis conducted on geographies consisting of 227,193,510 people shows no correlation between the proportion of Immigrants from Australia and percentage of population currently married in the United States with a correlation coefficient (R) of -0.020 and weighted average of 47.3%. Similarly, the statistical analysis conducted on geographies consisting of 226,093,582 people shows a weak positive correlation between the proportion of Malaysians and percentage of population currently married in the United States with a correlation coefficient (R) of 0.246 and weighted average of 45.9%, a difference of 2.9%.
Currently Married Correlation Summary
| Measurement | Immigrants from Australia | Malaysian |
| Minimum | 16.4% | 24.3% |
| Maximum | 80.8% | 68.6% |
| Range | 64.4% | 44.3% |
| Mean | 51.5% | 48.3% |
| Median | 50.7% | 46.9% |
| Interquartile 25% (IQ1) | 45.2% | 43.9% |
| Interquartile 75% (IQ3) | 58.9% | 52.6% |
| Interquartile Range (IQR) | 13.7% | 8.7% |
| Standard Deviation (Sample) | 12.0% | 8.9% |
| Standard Deviation (Population) | 11.9% | 8.9% |
Similar Demographics by Currently Married
Demographics Similar to Immigrants from Australia by Currently Married
In terms of currently married, the demographic groups most similar to Immigrants from Australia are Immigrants from Malaysia (47.3%, a difference of 0.0%), Afghan (47.3%, a difference of 0.050%), Icelander (47.3%, a difference of 0.080%), Immigrants from Norway (47.2%, a difference of 0.080%), and Immigrants from Iraq (47.3%, a difference of 0.11%).
| Demographics | Rating | Rank | Currently Married |
| New Zealanders | 84.9 /100 | #127 | Excellent 47.4% |
| Portuguese | 84.2 /100 | #128 | Excellent 47.3% |
| Sri Lankans | 83.2 /100 | #129 | Excellent 47.3% |
| Immigrants | Iraq | 82.8 /100 | #130 | Excellent 47.3% |
| Icelanders | 82.4 /100 | #131 | Excellent 47.3% |
| Afghans | 81.8 /100 | #132 | Excellent 47.3% |
| Immigrants | Malaysia | 81.1 /100 | #133 | Excellent 47.3% |
| Immigrants | Australia | 81.1 /100 | #134 | Excellent 47.3% |
| Immigrants | Norway | 79.7 /100 | #135 | Good 47.2% |
| Immigrants | Vietnam | 78.2 /100 | #136 | Good 47.2% |
| Paraguayans | 77.8 /100 | #137 | Good 47.2% |
| Pakistanis | 77.5 /100 | #138 | Good 47.2% |
| Yugoslavians | 77.4 /100 | #139 | Good 47.2% |
| Cajuns | 75.3 /100 | #140 | Good 47.1% |
| Venezuelans | 74.4 /100 | #141 | Good 47.1% |
Demographics Similar to Malaysians by Currently Married
In terms of currently married, the demographic groups most similar to Malaysians are Immigrants from Albania (45.9%, a difference of 0.060%), Creek (46.0%, a difference of 0.13%), Immigrants from Costa Rica (46.0%, a difference of 0.27%), Taiwanese (45.8%, a difference of 0.29%), and Immigrants from Spain (45.8%, a difference of 0.30%).
| Demographics | Rating | Rank | Currently Married |
| South Americans | 23.8 /100 | #194 | Fair 46.1% |
| Immigrants | Nepal | 23.7 /100 | #195 | Fair 46.1% |
| Immigrants | Bosnia and Herzegovina | 22.2 /100 | #196 | Fair 46.1% |
| Immigrants | Kuwait | 21.7 /100 | #197 | Fair 46.1% |
| Immigrants | Colombia | 21.0 /100 | #198 | Fair 46.1% |
| Immigrants | Costa Rica | 19.6 /100 | #199 | Poor 46.0% |
| Creek | 17.2 /100 | #200 | Poor 46.0% |
| Malaysians | 15.3 /100 | #201 | Poor 45.9% |
| Immigrants | Albania | 14.5 /100 | #202 | Poor 45.9% |
| Taiwanese | 11.7 /100 | #203 | Poor 45.8% |
| Immigrants | Spain | 11.6 /100 | #204 | Poor 45.8% |
| South American Indians | 11.5 /100 | #205 | Poor 45.8% |
| Immigrants | Immigrants | 11.2 /100 | #206 | Poor 45.8% |
| Immigrants | South America | 10.8 /100 | #207 | Poor 45.7% |
| Alsatians | 10.8 /100 | #208 | Poor 45.7% |