Hungarian vs Immigrants from Micronesia 4 or more Vehicles in Household
COMPARE
Hungarian
Immigrants from Micronesia
4 or more Vehicles in Household
4 or more Vehicles in Household Comparison
Hungarians
Immigrants from Micronesia
6.4%
4 OR MORE VEHICLES IN HOUSEHOLD
61.1/ 100
METRIC RATING
164th/ 347
METRIC RANK
7.6%
4 OR MORE VEHICLES IN HOUSEHOLD
100.0/ 100
METRIC RATING
63rd/ 347
METRIC RANK
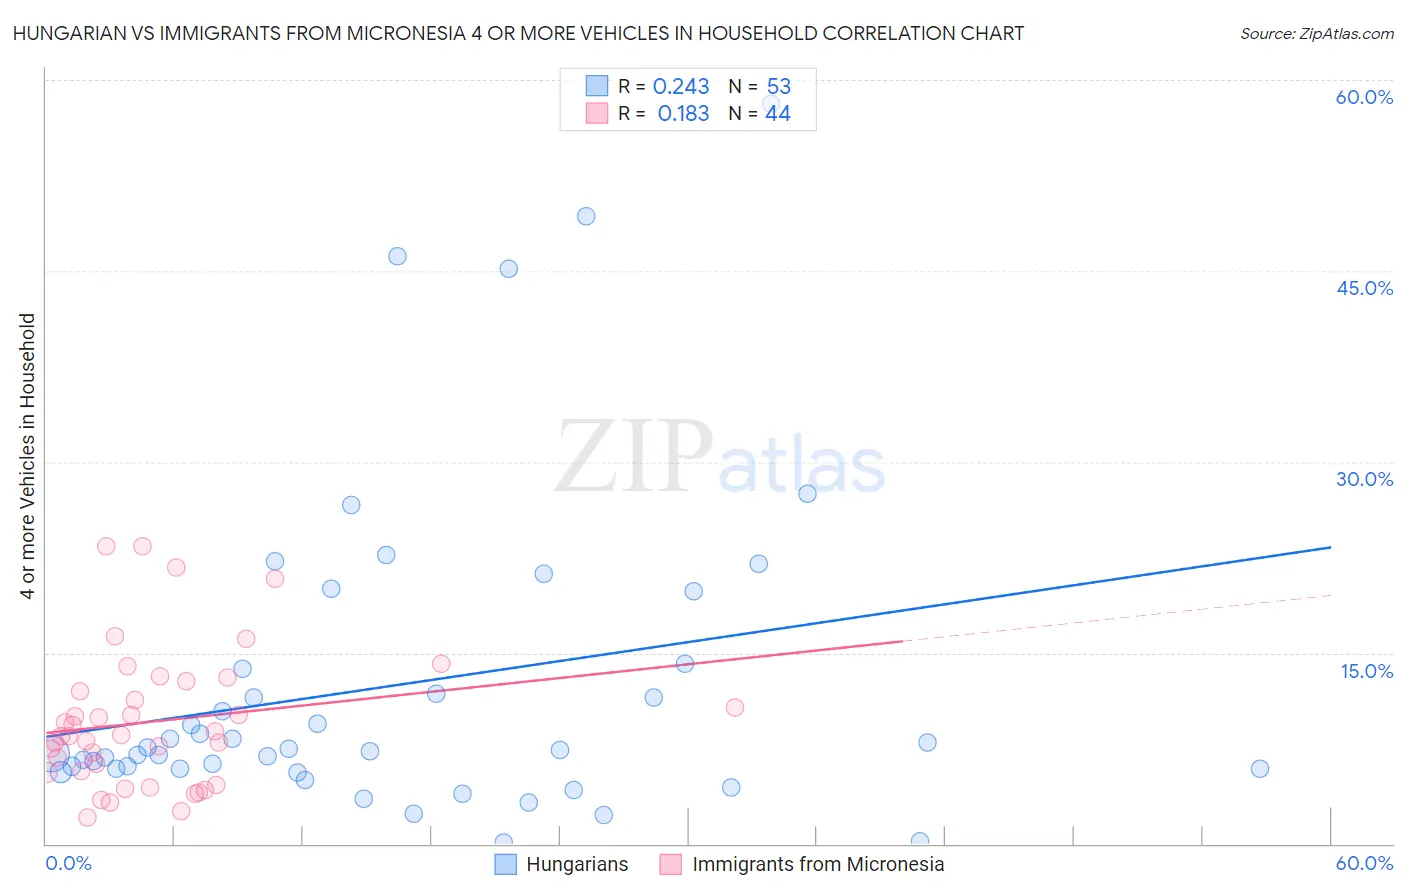
Hungarian vs Immigrants from Micronesia 4 or more Vehicles in Household Correlation Chart
The statistical analysis conducted on geographies consisting of 483,846,610 people shows a weak positive correlation between the proportion of Hungarians and percentage of households with 4 or more vehicles available in the United States with a correlation coefficient (R) of 0.243 and weighted average of 6.4%. Similarly, the statistical analysis conducted on geographies consisting of 61,547,693 people shows a poor positive correlation between the proportion of Immigrants from Micronesia and percentage of households with 4 or more vehicles available in the United States with a correlation coefficient (R) of 0.183 and weighted average of 7.6%, a difference of 18.3%.
4 or more Vehicles in Household Correlation Summary
| Measurement | Hungarian | Immigrants from Micronesia |
| Minimum | 0.062% | 2.1% |
| Maximum | 58.1% | 23.4% |
| Range | 58.1% | 21.3% |
| Mean | 12.4% | 9.6% |
| Median | 7.3% | 8.5% |
| Interquartile 25% (IQ1) | 5.9% | 5.7% |
| Interquartile 75% (IQ3) | 13.9% | 12.4% |
| Interquartile Range (IQR) | 8.0% | 6.7% |
| Standard Deviation (Sample) | 12.6% | 5.4% |
| Standard Deviation (Population) | 12.5% | 5.3% |
Similar Demographics by 4 or more Vehicles in Household
Demographics Similar to Hungarians by 4 or more Vehicles in Household
In terms of 4 or more vehicles in household, the demographic groups most similar to Hungarians are Chilean (6.4%, a difference of 0.010%), Immigrants from Peru (6.4%, a difference of 0.14%), Immigrants from Pakistan (6.4%, a difference of 0.22%), Immigrants from Cameroon (6.4%, a difference of 0.35%), and Immigrants from Denmark (6.4%, a difference of 0.35%).
| Demographics | Rating | Rank | 4 or more Vehicles in Household |
| Peruvians | 69.4 /100 | #157 | Good 6.5% |
| Zimbabweans | 67.1 /100 | #158 | Good 6.4% |
| Indians (Asian) | 66.3 /100 | #159 | Good 6.4% |
| Palestinians | 65.8 /100 | #160 | Good 6.4% |
| Immigrants | Cameroon | 64.4 /100 | #161 | Good 6.4% |
| Immigrants | Pakistan | 63.2 /100 | #162 | Good 6.4% |
| Chileans | 61.2 /100 | #163 | Good 6.4% |
| Hungarians | 61.1 /100 | #164 | Good 6.4% |
| Immigrants | Peru | 59.8 /100 | #165 | Average 6.4% |
| Immigrants | Denmark | 57.8 /100 | #166 | Average 6.4% |
| Poles | 56.9 /100 | #167 | Average 6.4% |
| Lebanese | 55.8 /100 | #168 | Average 6.4% |
| Estonians | 55.1 /100 | #169 | Average 6.4% |
| Immigrants | Syria | 52.8 /100 | #170 | Average 6.3% |
| Immigrants | India | 51.9 /100 | #171 | Average 6.3% |
Demographics Similar to Immigrants from Micronesia by 4 or more Vehicles in Household
In terms of 4 or more vehicles in household, the demographic groups most similar to Immigrants from Micronesia are Chippewa (7.6%, a difference of 0.010%), Bangladeshi (7.6%, a difference of 0.24%), European (7.6%, a difference of 0.27%), Immigrants from the Azores (7.5%, a difference of 0.28%), and Spaniard (7.6%, a difference of 0.53%).
| Demographics | Rating | Rank | 4 or more Vehicles in Household |
| English | 100.0 /100 | #56 | Exceptional 7.6% |
| Pennsylvania Germans | 100.0 /100 | #57 | Exceptional 7.6% |
| Swedes | 100.0 /100 | #58 | Exceptional 7.6% |
| Hispanics or Latinos | 100.0 /100 | #59 | Exceptional 7.6% |
| Spaniards | 100.0 /100 | #60 | Exceptional 7.6% |
| Europeans | 100.0 /100 | #61 | Exceptional 7.6% |
| Chippewa | 100.0 /100 | #62 | Exceptional 7.6% |
| Immigrants | Micronesia | 100.0 /100 | #63 | Exceptional 7.6% |
| Bangladeshis | 100.0 /100 | #64 | Exceptional 7.6% |
| Immigrants | Azores | 100.0 /100 | #65 | Exceptional 7.5% |
| Immigrants | Taiwan | 99.9 /100 | #66 | Exceptional 7.5% |
| Americans | 99.9 /100 | #67 | Exceptional 7.5% |
| Welsh | 99.9 /100 | #68 | Exceptional 7.5% |
| Germans | 99.9 /100 | #69 | Exceptional 7.5% |
| Scottish | 99.9 /100 | #70 | Exceptional 7.4% |