Hungarian vs Potawatomi 4 or more Vehicles in Household

COMPARE

Hungarian
Race
Ancestry
AfghanAfricanAlaska NativeAlaskan AthabascanAlbanianAleutAlsatianAmericanApacheArabArapahoArgentineanArmenianAssyrian/Chaldean/SyriacAustralianAustrianBahamianBangladeshiBarbadianBasqueBelgianBelizeanBermudanBhutaneseBlackfeetBolivianBrazilianBritishBritish West IndianBulgarianBurmeseCajunCambodianCanadianCape VerdeanCarpatho RusynCelticCentral AmericanCentral American IndianCherokeeCheyenneChickasawChileanChineseChippewaChoctawColombianColvilleComancheCosta RicanCreeCreekCroatianCrowCubanCypriotCzechCzechoslovakianDanishDelawareDominicanDutchDutch West IndianEastern EuropeanEcuadorianEgyptianEnglishEstonianEthiopianEuropeanFijianFilipinoFinnishFrenchFrench American IndianFrench CanadianGermanGerman RussianGhanaianGreekGuamanian/ChamorroGuatemalanGuyaneseHaitianHmongHonduranHopiHoumaHungarianIcelanderIndian (Asian)IndonesianInupiatIranianIraqiIrishIroquoisIsraeliItalianJamaicanJapaneseJordanianKenyanKiowaKoreanLaotianLatvianLebaneseLiberianLithuanianLumbeeLuxembourgerMacedonianMalaysianMalteseMarshalleseMenomineeMexicanMexican American IndianMongolianMoroccanNative HawaiianNavajoNepaleseNew ZealanderNicaraguanNigerianNorthern EuropeanNorwegianOkinawanOsageOttawaPaiutePakistaniPalestinianPanamanianParaguayanPennsylvania GermanPeruvianPimaPolishPortuguesePuebloPuerto RicanPuget Sound SalishRomanianRussianSalvadoranSamoanScandinavianScotch-IrishScottishSeminoleSenegaleseSerbianShoshoneSierra LeoneanSiouxSlavicSlovakSloveneSomaliSouth AfricanSouth AmericanSouth American IndianSoviet UnionSpaniardSpanishSpanish AmericanSpanish American IndianSri LankanSubsaharan AfricanSudaneseSwedishSwissSyrianTaiwaneseThaiTlingit-HaidaTohono O'OdhamTonganTrinidadian and TobagonianTsimshianTurkishU.S. Virgin IslanderUgandanUkrainianUruguayanUteVenezuelanVietnameseWelshWest IndianYakamaYaquiYugoslavianYumanYup'ikZimbabwean
Immigration
NonimmigrantsImmigrantsAfghanistanAfricaAlbaniaArgentinaArmeniaAsiaAustraliaAustriaBahamasBangladeshBarbadosBelarusBelgiumBelizeBoliviaBosnia and HerzegovinaBrazilBulgariaBurma/MyanmarCabo VerdeCambodiaCameroonCanadaCaribbeanCentral AmericaChileChinaColombiaCongoCosta RicaCroatiaCubaCzechoslovakiaDenmarkDominicaDominican RepublicEastern AfricaEastern AsiaEastern EuropeEcuadorEgyptEl SalvadorEnglandEritreaEthiopiaEuropeFijiFranceGermanyGhanaGreeceGrenadaGuatemalaGuyanaHaitiHondurasHong KongHungaryIndiaIndonesiaIranIraqIrelandIsraelItalyJamaicaJapanJordanKazakhstanKenyaKoreaKuwaitLaosLatin AmericaLatviaLebanonLiberiaLithuaniaMalaysiaMexicoMicronesiaMiddle AfricaMoldovaMoroccoNepalNetherlandsNicaraguaNigeriaNorth AmericaNorth MacedoniaNorthern AfricaNorthern EuropeNorwayOceaniaPakistanPanamaPeruPhilippinesPolandPortugalRomaniaRussiaSaudi ArabiaScotlandSenegalSerbiaSierra LeoneSingaporeSomaliaSouth AfricaSouth AmericaSouth Central AsiaSouth Eastern AsiaSouthern EuropeSpainSri LankaSt. Vincent and the GrenadinesSudanSwedenSwitzerlandSyriaTaiwanThailandTrinidad and TobagoTurkeyUgandaUkraineUruguayUzbekistanVenezuelaVietnamWest IndiesWestern AfricaWestern AsiaWestern EuropeYemenZaireZimbabweAzores
Potawatomi
Race
Ancestry
AfghanAfricanAlaska NativeAlaskan AthabascanAlbanianAleutAlsatianAmericanApacheArabArapahoArgentineanArmenianAssyrian/Chaldean/SyriacAustralianAustrianBahamianBangladeshiBarbadianBasqueBelgianBelizeanBermudanBhutaneseBlackfeetBolivianBrazilianBritishBritish West IndianBulgarianBurmeseCajunCambodianCanadianCape VerdeanCarpatho RusynCelticCentral AmericanCentral American IndianCherokeeCheyenneChickasawChileanChineseChippewaChoctawColombianColvilleComancheCosta RicanCreeCreekCroatianCrowCubanCypriotCzechCzechoslovakianDanishDelawareDominicanDutchDutch West IndianEastern EuropeanEcuadorianEgyptianEnglishEstonianEthiopianEuropeanFijianFilipinoFinnishFrenchFrench American IndianFrench CanadianGermanGerman RussianGhanaianGreekGuamanian/ChamorroGuatemalanGuyaneseHaitianHmongHonduranHopiHoumaIcelanderIndian (Asian)IndonesianInupiatIranianIraqiIrishIroquoisIsraeliItalianJamaicanJapaneseJordanianKenyanKiowaKoreanLaotianLatvianLebaneseLiberianLithuanianLumbeeLuxembourgerMacedonianMalaysianMalteseMarshalleseMenomineeMexicanMexican American IndianMongolianMoroccanNative HawaiianNavajoNepaleseNew ZealanderNicaraguanNigerianNorthern EuropeanNorwegianOkinawanOsageOttawaPaiutePakistaniPalestinianPanamanianParaguayanPennsylvania GermanPeruvianPimaPolishPortuguesePotawatomiPuebloPuerto RicanPuget Sound SalishRomanianRussianSalvadoranSamoanScandinavianScotch-IrishScottishSeminoleSenegaleseSerbianShoshoneSierra LeoneanSiouxSlavicSlovakSloveneSomaliSouth AfricanSouth AmericanSouth American IndianSoviet UnionSpaniardSpanishSpanish AmericanSpanish American IndianSri LankanSubsaharan AfricanSudaneseSwedishSwissSyrianTaiwaneseThaiTlingit-HaidaTohono O'OdhamTonganTrinidadian and TobagonianTsimshianTurkishU.S. Virgin IslanderUgandanUkrainianUruguayanUteVenezuelanVietnameseWelshWest IndianYakamaYaquiYugoslavianYumanYup'ikZimbabwean
Immigration
NonimmigrantsImmigrantsAfghanistanAfricaAlbaniaArgentinaArmeniaAsiaAustraliaAustriaBahamasBangladeshBarbadosBelarusBelgiumBelizeBoliviaBosnia and HerzegovinaBrazilBulgariaBurma/MyanmarCabo VerdeCambodiaCameroonCanadaCaribbeanCentral AmericaChileChinaColombiaCongoCosta RicaCroatiaCubaCzechoslovakiaDenmarkDominicaDominican RepublicEastern AfricaEastern AsiaEastern EuropeEcuadorEgyptEl SalvadorEnglandEritreaEthiopiaEuropeFijiFranceGermanyGhanaGreeceGrenadaGuatemalaGuyanaHaitiHondurasHong KongHungaryIndiaIndonesiaIranIraqIrelandIsraelItalyJamaicaJapanJordanKazakhstanKenyaKoreaKuwaitLaosLatin AmericaLatviaLebanonLiberiaLithuaniaMalaysiaMexicoMicronesiaMiddle AfricaMoldovaMoroccoNepalNetherlandsNicaraguaNigeriaNorth AmericaNorth MacedoniaNorthern AfricaNorthern EuropeNorwayOceaniaPakistanPanamaPeruPhilippinesPolandPortugalRomaniaRussiaSaudi ArabiaScotlandSenegalSerbiaSierra LeoneSingaporeSomaliaSouth AfricaSouth AmericaSouth Central AsiaSouth Eastern AsiaSouthern EuropeSpainSri LankaSt. Vincent and the GrenadinesSudanSwedenSwitzerlandSyriaTaiwanThailandTrinidad and TobagoTurkeyUgandaUkraineUruguayUzbekistanVenezuelaVietnamWest IndiesWestern AfricaWestern AsiaWestern EuropeYemenZaireZimbabweAzores
4 or more Vehicles in Household
Income
Poverty
Unemployment
Labor Participation
Family Structure
Vehicle Availability
Education Level
Disability

4 or more Vehicles in Household Comparison

Hungarians

Potawatomi

Good
Exceptional
6.4%
4 OR MORE VEHICLES IN HOUSEHOLD
61.1/ 100
METRIC RATING
164th/ 347
METRIC RANK
7.3%
4 OR MORE VEHICLES IN HOUSEHOLD
99.7/ 100
METRIC RATING
83rd/ 347
METRIC RANK

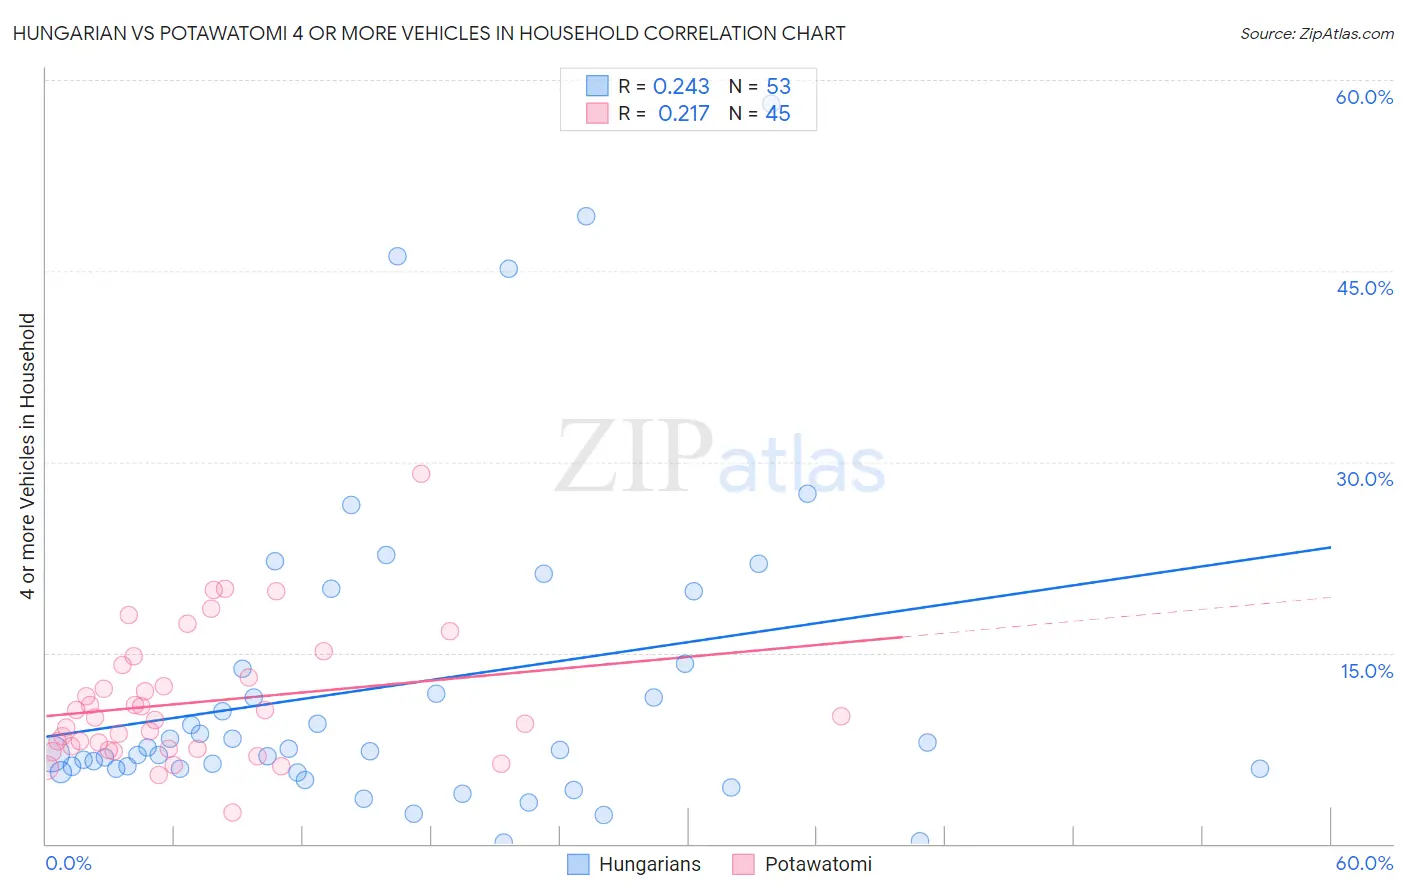
Hungarian vs Potawatomi 4 or more Vehicles in Household Correlation Chart

The statistical analysis conducted on geographies consisting of 483,846,610 people shows a weak positive correlation between the proportion of Hungarians and percentage of households with 4 or more vehicles available in the United States with a correlation coefficient (R) of 0.243 and weighted average of 6.4%. Similarly, the statistical analysis conducted on geographies consisting of 117,653,043 people shows a weak positive correlation between the proportion of Potawatomi and percentage of households with 4 or more vehicles available in the United States with a correlation coefficient (R) of 0.217 and weighted average of 7.3%, a difference of 13.7%.
Hungarian vs Potawatomi 4 or more Vehicles in Household

4 or more Vehicles in Household Correlation Summary

MeasurementHungarianPotawatomi
Minimum0.062%2.4%
Maximum58.1%29.0%
Range58.1%26.6%
Mean12.4%11.1%
Median7.3%10.0%
Interquartile 25% (IQ1)5.9%7.5%
Interquartile 75% (IQ3)13.9%13.6%
Interquartile Range (IQR)8.0%6.1%
Standard Deviation (Sample)12.6%5.1%
Standard Deviation (Population)12.5%5.0%

Similar Demographics by 4 or more Vehicles in Household

Demographics Similar to Hungarians by 4 or more Vehicles in Household

In terms of 4 or more vehicles in household, the demographic groups most similar to Hungarians are Chilean (6.4%, a difference of 0.010%), Immigrants from Peru (6.4%, a difference of 0.14%), Immigrants from Pakistan (6.4%, a difference of 0.22%), Immigrants from Cameroon (6.4%, a difference of 0.35%), and Immigrants from Denmark (6.4%, a difference of 0.35%).
DemographicsRating | Rank4 or more Vehicles in Household
Peruvians
69.4
/100
|
#157
Good
6.5%
Zimbabweans
67.1
/100
|
#158
Good
6.4%
Indians (Asian)
66.3
/100
|
#159
Good
6.4%
Palestinians
65.8
/100
|
#160
Good
6.4%
Immigrants | Cameroon
64.4
/100
|
#161
Good
6.4%
Immigrants | Pakistan
63.2
/100
|
#162
Good
6.4%
Chileans
61.2
/100
|
#163
Good
6.4%
Hungarians
61.1
/100
|
#164
Good
6.4%
Immigrants | Peru
59.8
/100
|
#165
Average
6.4%
Immigrants | Denmark
57.8
/100
|
#166
Average
6.4%
Poles
56.9
/100
|
#167
Average
6.4%
Lebanese
55.8
/100
|
#168
Average
6.4%
Estonians
55.1
/100
|
#169
Average
6.4%
Immigrants | Syria
52.8
/100
|
#170
Average
6.3%
Immigrants | India
51.9
/100
|
#171
Average
6.3%

Demographics Similar to Potawatomi by 4 or more Vehicles in Household

In terms of 4 or more vehicles in household, the demographic groups most similar to Potawatomi are Northern European (7.3%, a difference of 0.12%), Finnish (7.3%, a difference of 0.32%), Afghan (7.3%, a difference of 0.33%), Cree (7.2%, a difference of 0.49%), and Immigrants from Indonesia (7.2%, a difference of 0.68%).
DemographicsRating | Rank4 or more Vehicles in Household
Laotians
99.9
/100
|
#76
Exceptional
7.4%
Apache
99.9
/100
|
#77
Exceptional
7.4%
Whites/Caucasians
99.8
/100
|
#78
Exceptional
7.4%
Czechs
99.8
/100
|
#79
Exceptional
7.4%
Alaska Natives
99.8
/100
|
#80
Exceptional
7.3%
Finns
99.8
/100
|
#81
Exceptional
7.3%
Northern Europeans
99.8
/100
|
#82
Exceptional
7.3%
Potawatomi
99.7
/100
|
#83
Exceptional
7.3%
Afghans
99.7
/100
|
#84
Exceptional
7.3%
Cree
99.7
/100
|
#85
Exceptional
7.2%
Immigrants | Indonesia
99.6
/100
|
#86
Exceptional
7.2%
Delaware
99.6
/100
|
#87
Exceptional
7.2%
Immigrants | Nonimmigrants
99.6
/100
|
#88
Exceptional
7.2%
British
99.6
/100
|
#89
Exceptional
7.2%
Creek
99.6
/100
|
#90
Exceptional
7.2%