Hispanic or Latino vs Bahamian No Vehicles in Household
COMPARE
Hispanic or Latino
Bahamian
No Vehicles in Household
No Vehicles in Household Comparison
Hispanics or Latinos
Bahamians
9.1%
NO VEHICLES IN HOUSEHOLD
97.7/ 100
METRIC RATING
107th/ 347
METRIC RANK
9.9%
NO VEHICLES IN HOUSEHOLD
81.0/ 100
METRIC RATING
145th/ 347
METRIC RANK
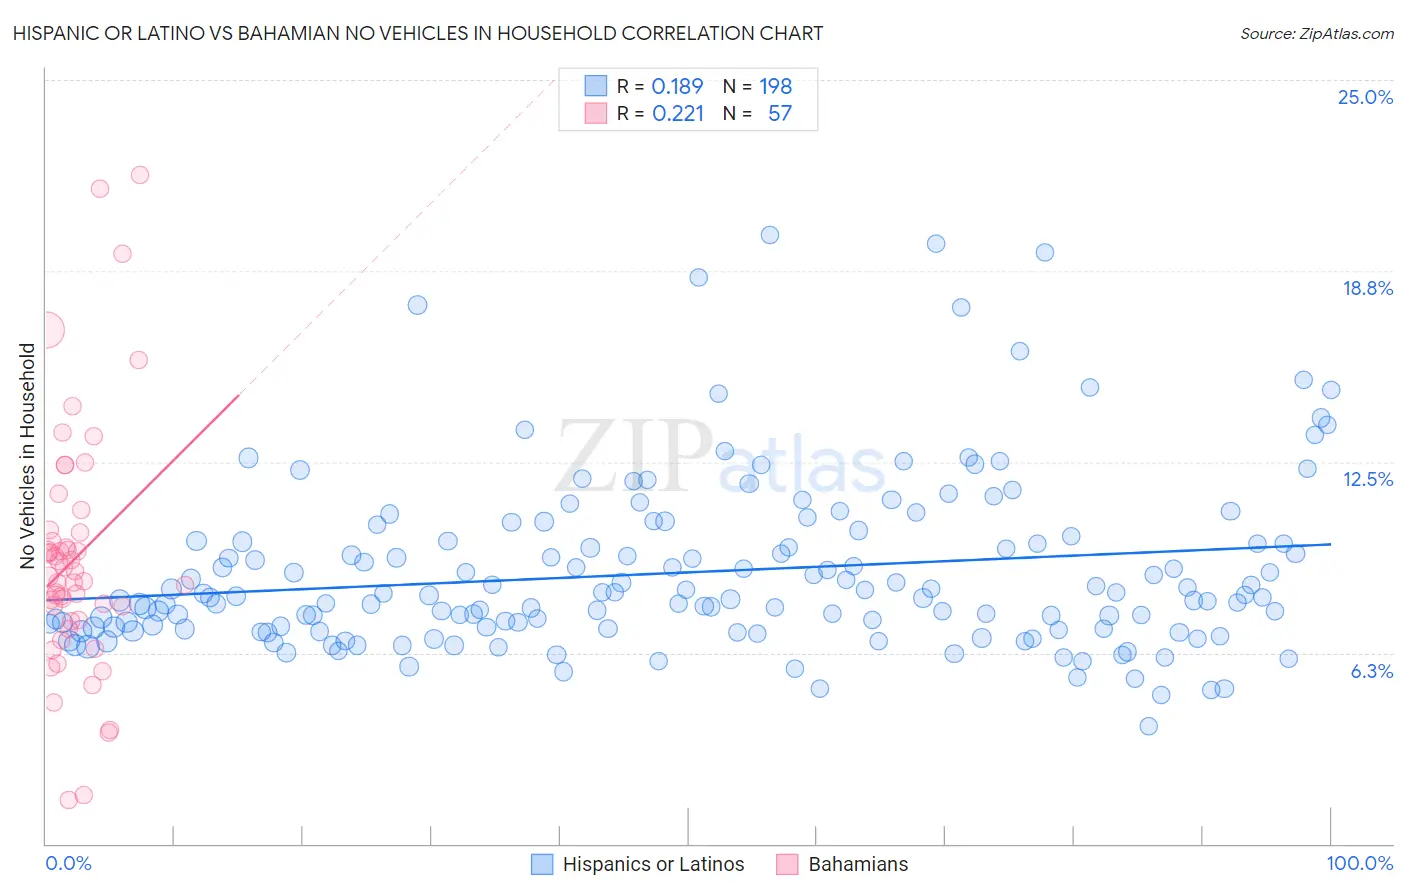
Hispanic or Latino vs Bahamian No Vehicles in Household Correlation Chart
The statistical analysis conducted on geographies consisting of 558,633,486 people shows a poor positive correlation between the proportion of Hispanics or Latinos and percentage of households with no vehicle available in the United States with a correlation coefficient (R) of 0.189 and weighted average of 9.1%. Similarly, the statistical analysis conducted on geographies consisting of 112,549,845 people shows a weak positive correlation between the proportion of Bahamians and percentage of households with no vehicle available in the United States with a correlation coefficient (R) of 0.221 and weighted average of 9.9%, a difference of 8.9%.
No Vehicles in Household Correlation Summary
| Measurement | Hispanic or Latino | Bahamian |
| Minimum | 3.8% | 1.4% |
| Maximum | 19.9% | 21.9% |
| Range | 16.1% | 20.5% |
| Mean | 8.9% | 9.3% |
| Median | 8.1% | 8.7% |
| Interquartile 25% (IQ1) | 7.0% | 7.3% |
| Interquartile 75% (IQ3) | 9.9% | 10.2% |
| Interquartile Range (IQR) | 2.9% | 2.9% |
| Standard Deviation (Sample) | 2.8% | 4.1% |
| Standard Deviation (Population) | 2.8% | 4.0% |
Similar Demographics by No Vehicles in Household
Demographics Similar to Hispanics or Latinos by No Vehicles in Household
In terms of no vehicles in household, the demographic groups most similar to Hispanics or Latinos are Mexican American Indian (9.1%, a difference of 0.080%), Maltese (9.1%, a difference of 0.21%), Laotian (9.1%, a difference of 0.26%), Spanish American (9.1%, a difference of 0.36%), and Zimbabwean (9.0%, a difference of 0.52%).
| Demographics | Rating | Rank | No Vehicles in Household |
| Asians | 98.3 /100 | #100 | Exceptional 9.0% |
| Pakistanis | 98.3 /100 | #101 | Exceptional 9.0% |
| Yugoslavians | 98.3 /100 | #102 | Exceptional 9.0% |
| Seminole | 98.3 /100 | #103 | Exceptional 9.0% |
| Zimbabweans | 98.0 /100 | #104 | Exceptional 9.0% |
| Spanish Americans | 97.9 /100 | #105 | Exceptional 9.1% |
| Laotians | 97.8 /100 | #106 | Exceptional 9.1% |
| Hispanics or Latinos | 97.7 /100 | #107 | Exceptional 9.1% |
| Mexican American Indians | 97.6 /100 | #108 | Exceptional 9.1% |
| Maltese | 97.6 /100 | #109 | Exceptional 9.1% |
| Delaware | 97.2 /100 | #110 | Exceptional 9.2% |
| Immigrants | Kuwait | 95.1 /100 | #111 | Exceptional 9.4% |
| Armenians | 95.0 /100 | #112 | Exceptional 9.4% |
| Immigrants | Netherlands | 94.8 /100 | #113 | Exceptional 9.4% |
| Serbians | 94.3 /100 | #114 | Exceptional 9.4% |
Demographics Similar to Bahamians by No Vehicles in Household
In terms of no vehicles in household, the demographic groups most similar to Bahamians are Chilean (9.9%, a difference of 0.030%), Immigrants from Bahamas (9.9%, a difference of 0.030%), Hungarian (9.9%, a difference of 0.23%), Immigrants from Nicaragua (9.9%, a difference of 0.28%), and Immigrants from Zimbabwe (9.9%, a difference of 0.38%).
| Demographics | Rating | Rank | No Vehicles in Household |
| Estonians | 84.2 /100 | #138 | Excellent 9.8% |
| Marshallese | 84.0 /100 | #139 | Excellent 9.8% |
| Immigrants | Lithuania | 84.0 /100 | #140 | Excellent 9.8% |
| Sudanese | 83.1 /100 | #141 | Excellent 9.8% |
| Immigrants | Zimbabwe | 82.6 /100 | #142 | Excellent 9.9% |
| Chileans | 81.2 /100 | #143 | Excellent 9.9% |
| Immigrants | Bahamas | 81.2 /100 | #144 | Excellent 9.9% |
| Bahamians | 81.0 /100 | #145 | Excellent 9.9% |
| Hungarians | 80.0 /100 | #146 | Excellent 9.9% |
| Immigrants | Nicaragua | 79.8 /100 | #147 | Good 9.9% |
| Immigrants | Bosnia and Herzegovina | 79.1 /100 | #148 | Good 9.9% |
| Immigrants | Uganda | 76.1 /100 | #149 | Good 10.0% |
| Colombians | 73.9 /100 | #150 | Good 10.0% |
| Immigrants | Eastern Africa | 73.8 /100 | #151 | Good 10.0% |
| Immigrants | Congo | 73.0 /100 | #152 | Good 10.1% |