Hispanic or Latino vs Bahamian Per Capita Income
COMPARE
Hispanic or Latino
Bahamian
Per Capita Income
Per Capita Income Comparison
Hispanics or Latinos
Bahamians
$35,688
PER CAPITA INCOME
0.0/ 100
METRIC RATING
320th/ 347
METRIC RANK
$36,427
PER CAPITA INCOME
0.0/ 100
METRIC RATING
313th/ 347
METRIC RANK
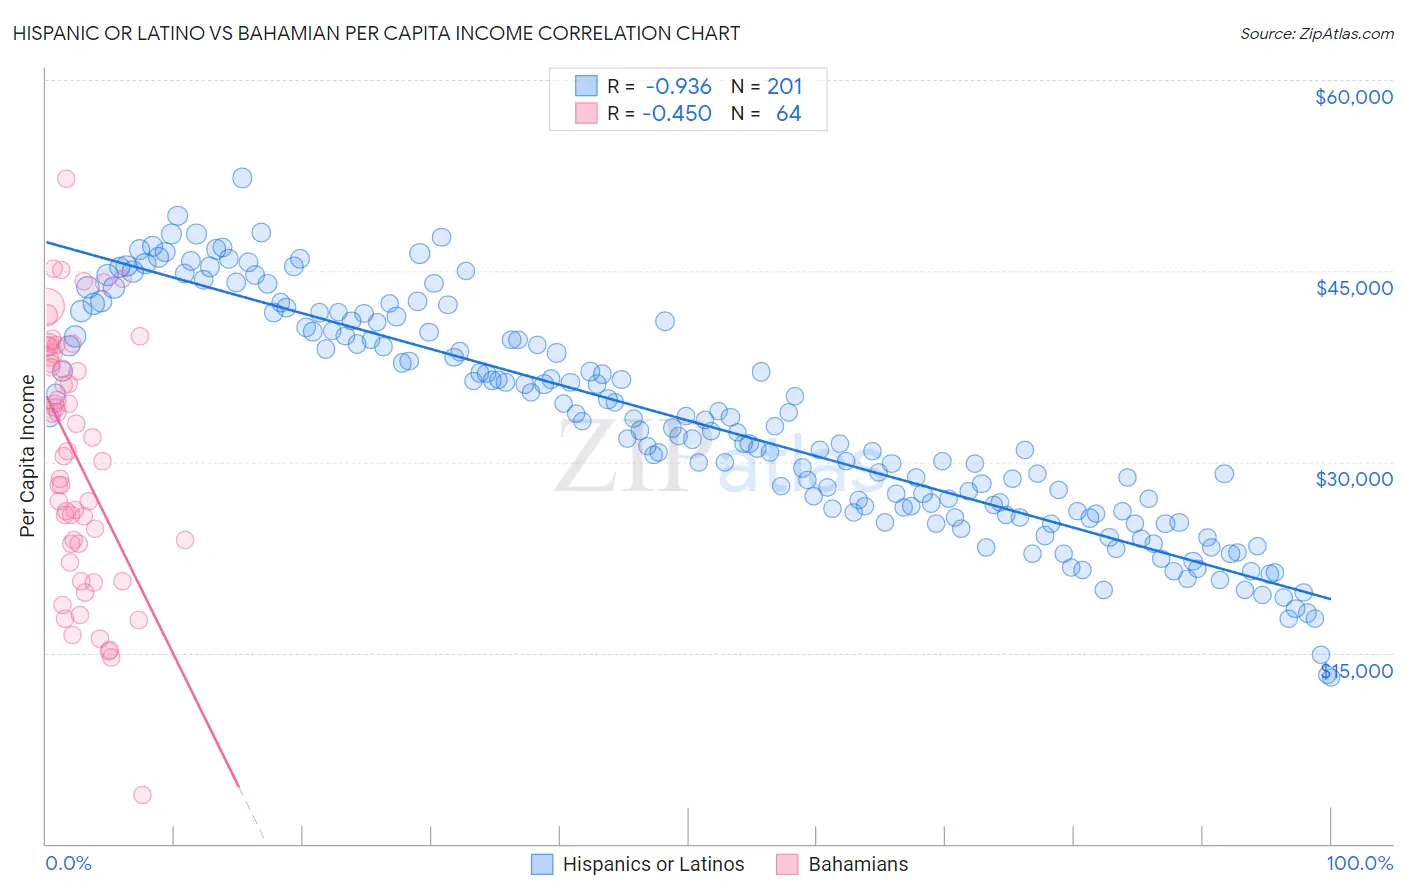
Hispanic or Latino vs Bahamian Per Capita Income Correlation Chart
The statistical analysis conducted on geographies consisting of 578,671,475 people shows a near-perfect negative correlation between the proportion of Hispanics or Latinos and per capita income in the United States with a correlation coefficient (R) of -0.936 and weighted average of $35,688. Similarly, the statistical analysis conducted on geographies consisting of 112,707,980 people shows a moderate negative correlation between the proportion of Bahamians and per capita income in the United States with a correlation coefficient (R) of -0.450 and weighted average of $36,427, a difference of 2.1%.
Per Capita Income Correlation Summary
| Measurement | Hispanic or Latino | Bahamian |
| Minimum | $13,071 | $3,864 |
| Maximum | $52,297 | $52,210 |
| Range | $39,226 | $48,346 |
| Mean | $33,168 | $30,310 |
| Median | $32,664 | $30,639 |
| Interquartile 25% (IQ1) | $26,111 | $23,571 |
| Interquartile 75% (IQ3) | $40,424 | $38,367 |
| Interquartile Range (IQR) | $14,314 | $14,797 |
| Standard Deviation (Sample) | $8,715 | $9,801 |
| Standard Deviation (Population) | $8,693 | $9,724 |
Demographics Similar to Hispanics or Latinos and Bahamians by Per Capita Income
In terms of per capita income, the demographic groups most similar to Hispanics or Latinos are Immigrants from Congo ($35,720, a difference of 0.090%), Black/African American ($35,564, a difference of 0.35%), Creek ($35,546, a difference of 0.40%), Bangladeshi ($35,897, a difference of 0.59%), and Dutch West Indian ($35,922, a difference of 0.66%). Similarly, the demographic groups most similar to Bahamians are Chickasaw ($36,475, a difference of 0.13%), Chippewa ($36,631, a difference of 0.56%), Ute ($36,651, a difference of 0.62%), Immigrants from Honduras ($36,665, a difference of 0.65%), and Seminole ($36,180, a difference of 0.68%).
| Demographics | Rating | Rank | Per Capita Income |
| Immigrants | Haiti | 0.0 /100 | #306 | Tragic $36,849 |
| Immigrants | Latin America | 0.0 /100 | #307 | Tragic $36,823 |
| Fijians | 0.0 /100 | #308 | Tragic $36,690 |
| Immigrants | Honduras | 0.0 /100 | #309 | Tragic $36,665 |
| Ute | 0.0 /100 | #310 | Tragic $36,651 |
| Chippewa | 0.0 /100 | #311 | Tragic $36,631 |
| Chickasaw | 0.0 /100 | #312 | Tragic $36,475 |
| Bahamians | 0.0 /100 | #313 | Tragic $36,427 |
| Seminole | 0.0 /100 | #314 | Tragic $36,180 |
| Yaqui | 0.0 /100 | #315 | Tragic $36,112 |
| Choctaw | 0.0 /100 | #316 | Tragic $35,999 |
| Dutch West Indians | 0.0 /100 | #317 | Tragic $35,922 |
| Bangladeshis | 0.0 /100 | #318 | Tragic $35,897 |
| Immigrants | Congo | 0.0 /100 | #319 | Tragic $35,720 |
| Hispanics or Latinos | 0.0 /100 | #320 | Tragic $35,688 |
| Blacks/African Americans | 0.0 /100 | #321 | Tragic $35,564 |
| Creek | 0.0 /100 | #322 | Tragic $35,546 |
| Cheyenne | 0.0 /100 | #323 | Tragic $35,276 |
| Kiowa | 0.0 /100 | #324 | Tragic $35,102 |
| Immigrants | Central America | 0.0 /100 | #325 | Tragic $34,974 |
| Immigrants | Cuba | 0.0 /100 | #326 | Tragic $34,910 |