Immigrants from Oceania vs Immigrants from Honduras No Vehicles in Household
COMPARE
Immigrants from Oceania
Immigrants from Honduras
No Vehicles in Household
No Vehicles in Household Comparison
Immigrants from Oceania
Immigrants from Honduras
9.7%
NO VEHICLES IN HOUSEHOLD
87.1/ 100
METRIC RATING
133rd/ 347
METRIC RANK
11.8%
NO VEHICLES IN HOUSEHOLD
2.1/ 100
METRIC RATING
245th/ 347
METRIC RANK
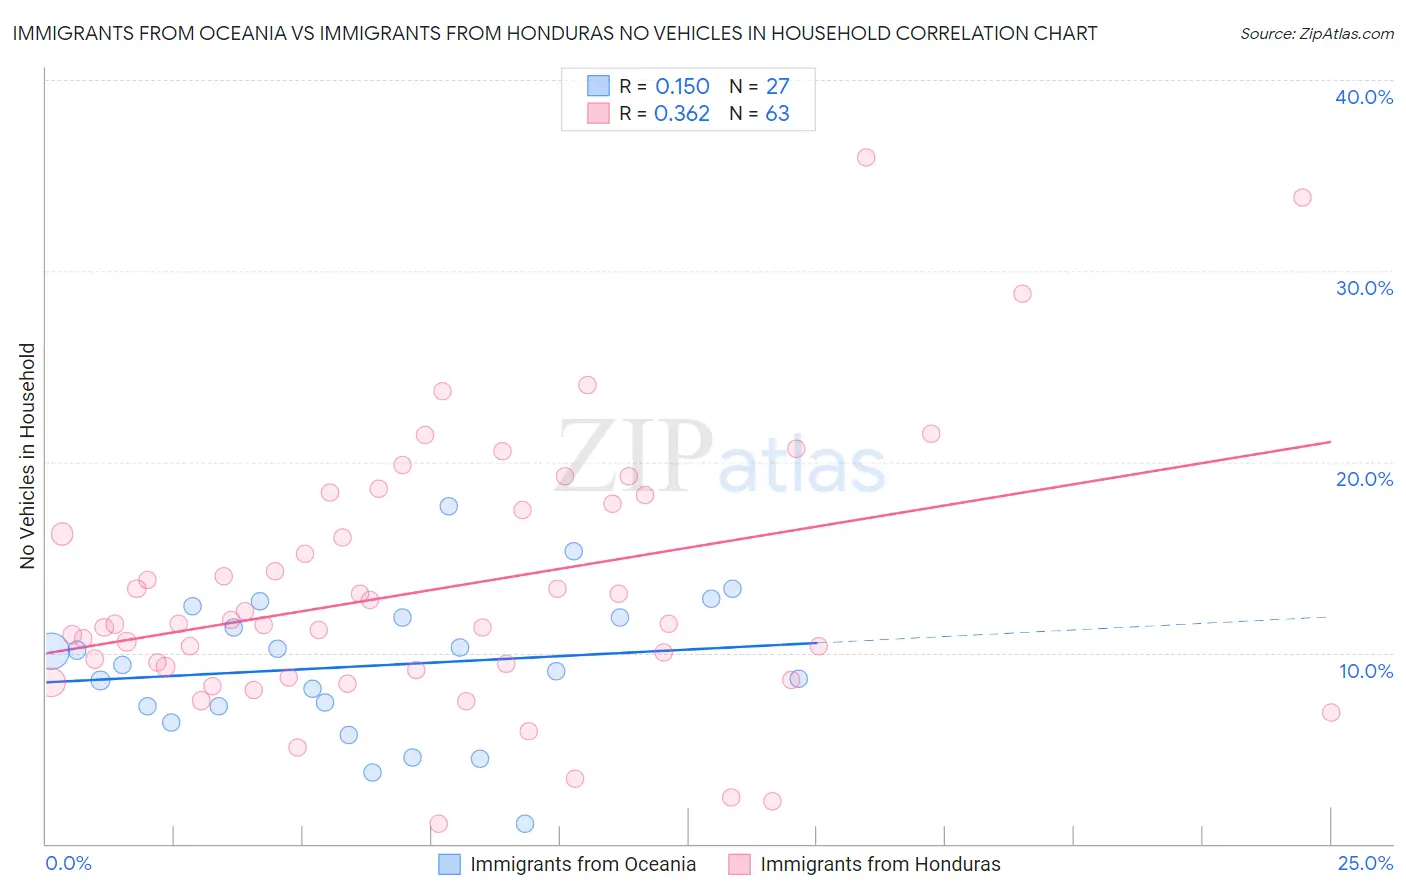
Immigrants from Oceania vs Immigrants from Honduras No Vehicles in Household Correlation Chart
The statistical analysis conducted on geographies consisting of 304,786,769 people shows a poor positive correlation between the proportion of Immigrants from Oceania and percentage of households with no vehicle available in the United States with a correlation coefficient (R) of 0.150 and weighted average of 9.7%. Similarly, the statistical analysis conducted on geographies consisting of 322,146,811 people shows a mild positive correlation between the proportion of Immigrants from Honduras and percentage of households with no vehicle available in the United States with a correlation coefficient (R) of 0.362 and weighted average of 11.8%, a difference of 20.8%.
No Vehicles in Household Correlation Summary
| Measurement | Immigrants from Oceania | Immigrants from Honduras |
| Minimum | 1.0% | 1.0% |
| Maximum | 17.7% | 35.9% |
| Range | 16.7% | 34.9% |
| Mean | 9.3% | 13.3% |
| Median | 9.4% | 11.5% |
| Interquartile 25% (IQ1) | 7.2% | 9.1% |
| Interquartile 75% (IQ3) | 11.9% | 17.8% |
| Interquartile Range (IQR) | 4.7% | 8.7% |
| Standard Deviation (Sample) | 3.7% | 6.9% |
| Standard Deviation (Population) | 3.6% | 6.8% |
Similar Demographics by No Vehicles in Household
Demographics Similar to Immigrants from Oceania by No Vehicles in Household
In terms of no vehicles in household, the demographic groups most similar to Immigrants from Oceania are Syrian (9.7%, a difference of 0.020%), Kenyan (9.7%, a difference of 0.30%), Immigrants from the Azores (9.7%, a difference of 0.37%), Burmese (9.7%, a difference of 0.58%), and Latvian (9.8%, a difference of 0.60%).
| Demographics | Rating | Rank | No Vehicles in Household |
| Icelanders | 90.2 /100 | #126 | Exceptional 9.6% |
| Immigrants | Kenya | 89.7 /100 | #127 | Excellent 9.6% |
| Immigrants | Syria | 89.5 /100 | #128 | Excellent 9.6% |
| Nicaraguans | 89.5 /100 | #129 | Excellent 9.7% |
| Burmese | 88.8 /100 | #130 | Excellent 9.7% |
| Immigrants | Azores | 88.2 /100 | #131 | Excellent 9.7% |
| Kenyans | 88.0 /100 | #132 | Excellent 9.7% |
| Immigrants | Oceania | 87.1 /100 | #133 | Excellent 9.7% |
| Syrians | 87.1 /100 | #134 | Excellent 9.7% |
| Latvians | 85.1 /100 | #135 | Excellent 9.8% |
| Immigrants | South Africa | 85.0 /100 | #136 | Excellent 9.8% |
| Immigrants | Moldova | 84.6 /100 | #137 | Excellent 9.8% |
| Estonians | 84.2 /100 | #138 | Excellent 9.8% |
| Marshallese | 84.0 /100 | #139 | Excellent 9.8% |
| Immigrants | Lithuania | 84.0 /100 | #140 | Excellent 9.8% |
Demographics Similar to Immigrants from Honduras by No Vehicles in Household
In terms of no vehicles in household, the demographic groups most similar to Immigrants from Honduras are Menominee (11.8%, a difference of 0.17%), Immigrants from Portugal (11.7%, a difference of 0.19%), Immigrants from Czechoslovakia (11.8%, a difference of 0.22%), Immigrants from Belgium (11.8%, a difference of 0.23%), and Immigrants from Nigeria (11.8%, a difference of 0.26%).
| Demographics | Rating | Rank | No Vehicles in Household |
| Russians | 3.2 /100 | #238 | Tragic 11.6% |
| Taiwanese | 2.8 /100 | #239 | Tragic 11.7% |
| Immigrants | Immigrants | 2.7 /100 | #240 | Tragic 11.7% |
| Eastern Europeans | 2.7 /100 | #241 | Tragic 11.7% |
| Turks | 2.6 /100 | #242 | Tragic 11.7% |
| Cheyenne | 2.4 /100 | #243 | Tragic 11.7% |
| Immigrants | Portugal | 2.2 /100 | #244 | Tragic 11.7% |
| Immigrants | Honduras | 2.1 /100 | #245 | Tragic 11.8% |
| Menominee | 2.0 /100 | #246 | Tragic 11.8% |
| Immigrants | Czechoslovakia | 2.0 /100 | #247 | Tragic 11.8% |
| Immigrants | Belgium | 1.9 /100 | #248 | Tragic 11.8% |
| Immigrants | Nigeria | 1.9 /100 | #249 | Tragic 11.8% |
| Paiute | 1.8 /100 | #250 | Tragic 11.8% |
| Blacks/African Americans | 1.6 /100 | #251 | Tragic 11.9% |
| Immigrants | Serbia | 1.5 /100 | #252 | Tragic 11.9% |