Immigrants from Northern Europe vs Guatemalan No Vehicles in Household
COMPARE
Immigrants from Northern Europe
Guatemalan
No Vehicles in Household
No Vehicles in Household Comparison
Immigrants from Northern Europe
Guatemalans
10.7%
NO VEHICLES IN HOUSEHOLD
33.1/ 100
METRIC RATING
191st/ 347
METRIC RANK
11.0%
NO VEHICLES IN HOUSEHOLD
16.1/ 100
METRIC RATING
204th/ 347
METRIC RANK
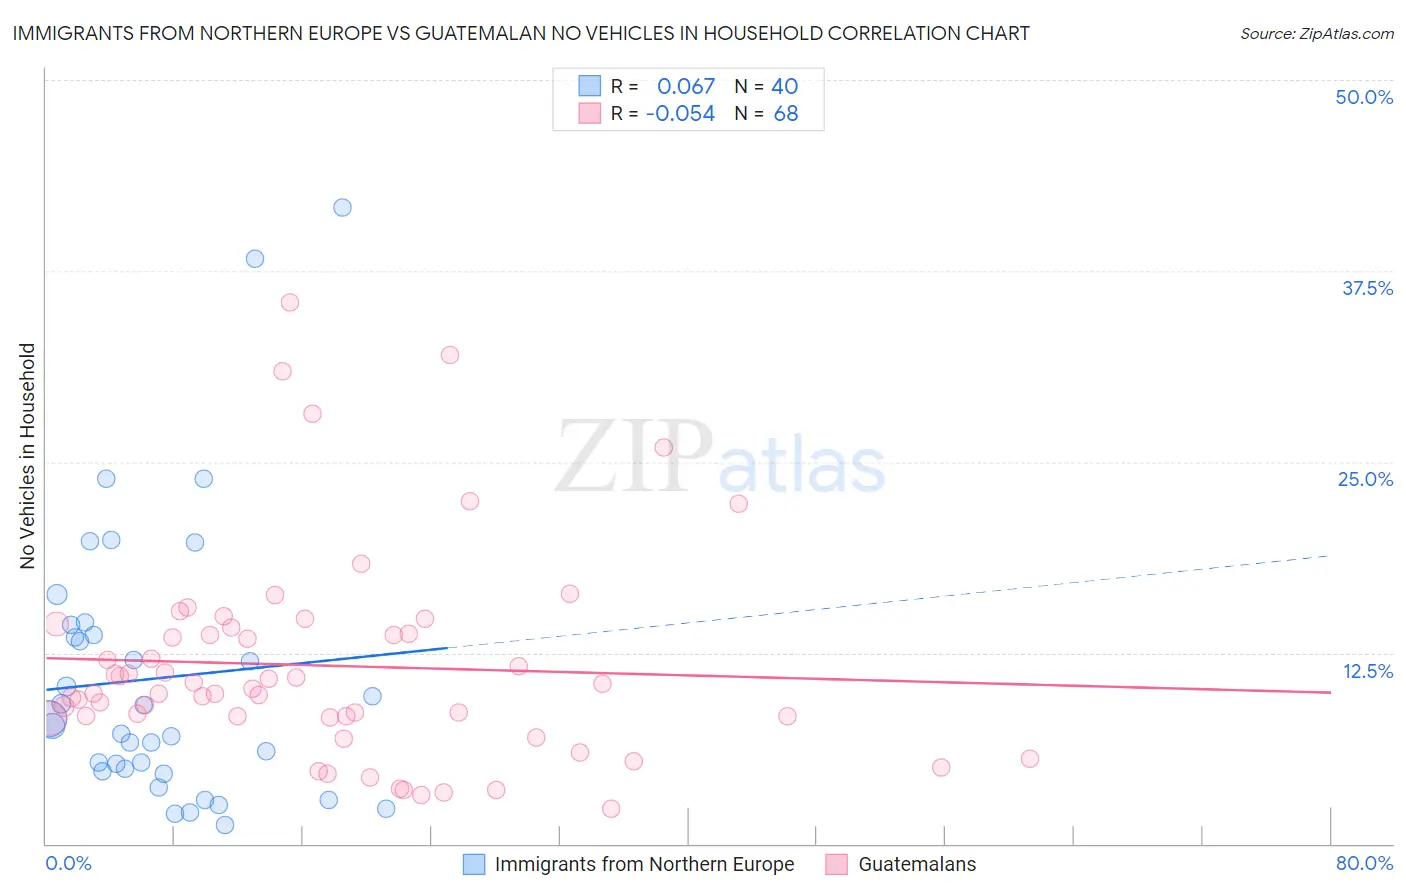
Immigrants from Northern Europe vs Guatemalan No Vehicles in Household Correlation Chart
The statistical analysis conducted on geographies consisting of 475,076,775 people shows a slight positive correlation between the proportion of Immigrants from Northern Europe and percentage of households with no vehicle available in the United States with a correlation coefficient (R) of 0.067 and weighted average of 10.7%. Similarly, the statistical analysis conducted on geographies consisting of 408,589,655 people shows a slight negative correlation between the proportion of Guatemalans and percentage of households with no vehicle available in the United States with a correlation coefficient (R) of -0.054 and weighted average of 11.0%, a difference of 3.1%.
No Vehicles in Household Correlation Summary
| Measurement | Immigrants from Northern Europe | Guatemalan |
| Minimum | 1.2% | 2.3% |
| Maximum | 41.7% | 35.5% |
| Range | 40.4% | 33.2% |
| Mean | 10.8% | 11.7% |
| Median | 7.9% | 10.0% |
| Interquartile 25% (IQ1) | 4.8% | 8.3% |
| Interquartile 75% (IQ3) | 14.0% | 13.9% |
| Interquartile Range (IQR) | 9.2% | 5.6% |
| Standard Deviation (Sample) | 9.1% | 6.9% |
| Standard Deviation (Population) | 9.0% | 6.8% |
Demographics Similar to Immigrants from Northern Europe and Guatemalans by No Vehicles in Household
In terms of no vehicles in household, the demographic groups most similar to Immigrants from Northern Europe are Carpatho Rusyn (10.7%, a difference of 0.14%), Immigrants from North Macedonia (10.6%, a difference of 0.23%), Immigrants from Eritrea (10.6%, a difference of 0.47%), Immigrants from Armenia (10.6%, a difference of 0.65%), and Immigrants from Poland (10.6%, a difference of 0.77%). Similarly, the demographic groups most similar to Guatemalans are Immigrants from Chile (11.0%, a difference of 0.040%), Somali (11.0%, a difference of 0.050%), Sierra Leonean (11.0%, a difference of 0.10%), Iroquois (10.9%, a difference of 0.34%), and Romanian (10.9%, a difference of 0.41%).
| Demographics | Rating | Rank | No Vehicles in Household |
| Immigrants | Poland | 38.4 /100 | #187 | Fair 10.6% |
| Immigrants | Armenia | 37.5 /100 | #188 | Fair 10.6% |
| Immigrants | Eritrea | 36.3 /100 | #189 | Fair 10.6% |
| Immigrants | North Macedonia | 34.6 /100 | #190 | Fair 10.6% |
| Immigrants | Northern Europe | 33.1 /100 | #191 | Fair 10.7% |
| Carpatho Rusyns | 32.1 /100 | #192 | Fair 10.7% |
| Ukrainians | 28.0 /100 | #193 | Fair 10.7% |
| Pueblo | 27.0 /100 | #194 | Fair 10.8% |
| Immigrants | Brazil | 26.3 /100 | #195 | Fair 10.8% |
| Central Americans | 24.3 /100 | #196 | Fair 10.8% |
| Shoshone | 24.1 /100 | #197 | Fair 10.8% |
| Immigrants | Sweden | 22.9 /100 | #198 | Fair 10.8% |
| Immigrants | Asia | 21.3 /100 | #199 | Fair 10.9% |
| Cambodians | 19.6 /100 | #200 | Poor 10.9% |
| Immigrants | Western Europe | 19.1 /100 | #201 | Poor 10.9% |
| Romanians | 17.9 /100 | #202 | Poor 10.9% |
| Iroquois | 17.6 /100 | #203 | Poor 10.9% |
| Guatemalans | 16.1 /100 | #204 | Poor 11.0% |
| Immigrants | Chile | 15.9 /100 | #205 | Poor 11.0% |
| Somalis | 15.9 /100 | #206 | Poor 11.0% |
| Sierra Leoneans | 15.7 /100 | #207 | Poor 11.0% |