Guyanese vs Arab No Vehicles in Household
COMPARE
Guyanese
Arab
No Vehicles in Household
No Vehicles in Household Comparison
Guyanese
Arabs
29.3%
NO VEHICLES IN HOUSEHOLD
0.0/ 100
METRIC RATING
338th/ 347
METRIC RANK
10.5%
NO VEHICLES IN HOUSEHOLD
45.3/ 100
METRIC RATING
180th/ 347
METRIC RANK
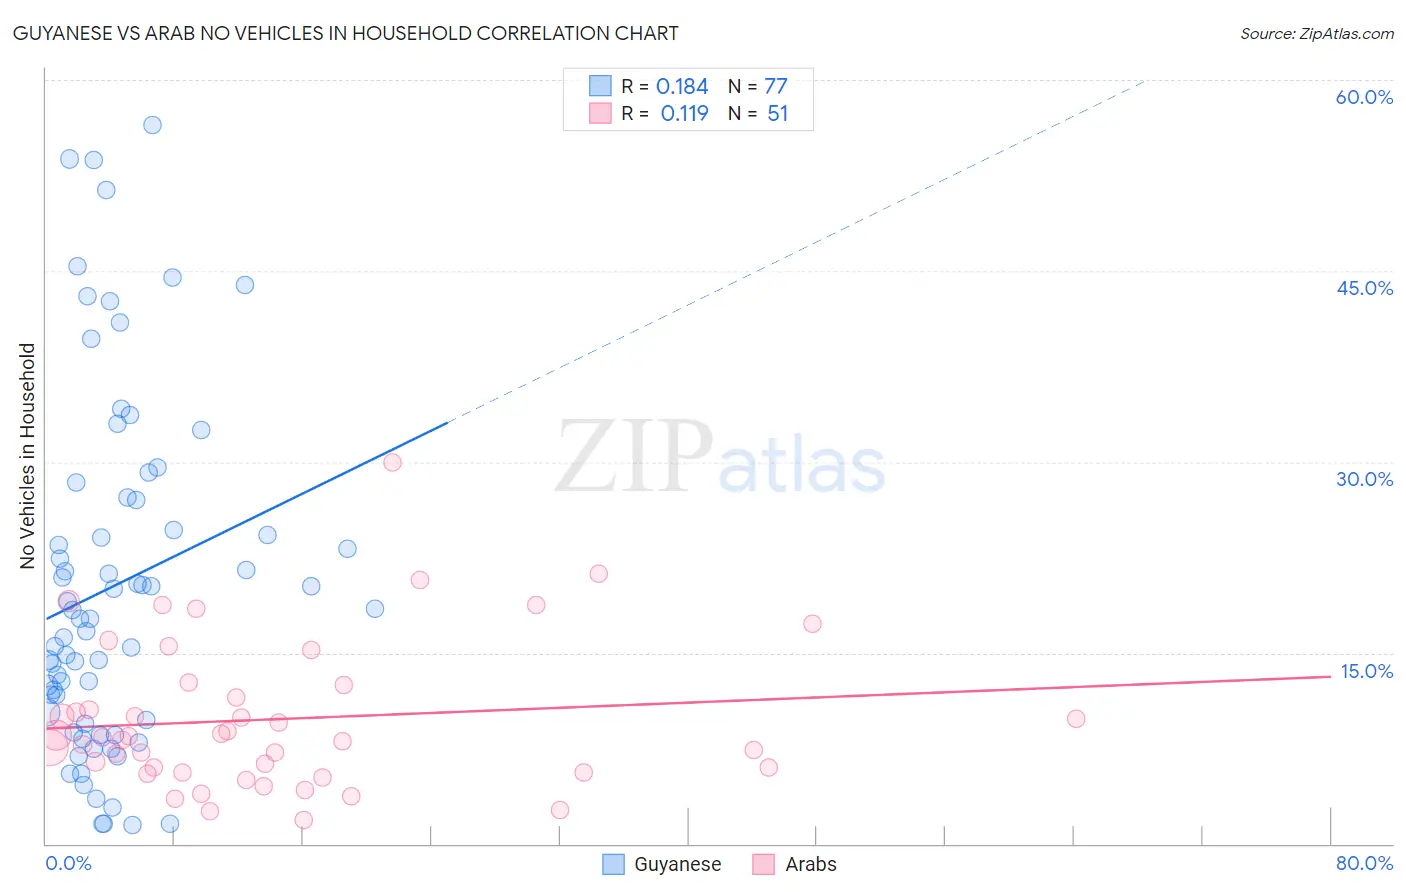
Guyanese vs Arab No Vehicles in Household Correlation Chart
The statistical analysis conducted on geographies consisting of 176,563,698 people shows a poor positive correlation between the proportion of Guyanese and percentage of households with no vehicle available in the United States with a correlation coefficient (R) of 0.184 and weighted average of 29.3%. Similarly, the statistical analysis conducted on geographies consisting of 484,728,564 people shows a poor positive correlation between the proportion of Arabs and percentage of households with no vehicle available in the United States with a correlation coefficient (R) of 0.119 and weighted average of 10.5%, a difference of 179.9%.
No Vehicles in Household Correlation Summary
| Measurement | Guyanese | Arab |
| Minimum | 1.4% | 1.9% |
| Maximum | 56.4% | 30.0% |
| Range | 55.0% | 28.1% |
| Mean | 20.3% | 9.8% |
| Median | 17.7% | 8.4% |
| Interquartile 25% (IQ1) | 9.6% | 5.6% |
| Interquartile 75% (IQ3) | 27.1% | 12.5% |
| Interquartile Range (IQR) | 17.6% | 6.9% |
| Standard Deviation (Sample) | 13.7% | 5.8% |
| Standard Deviation (Population) | 13.6% | 5.8% |
Similar Demographics by No Vehicles in Household
Demographics Similar to Guyanese by No Vehicles in Household
In terms of no vehicles in household, the demographic groups most similar to Guyanese are Dominican (29.4%, a difference of 0.36%), Immigrants from Barbados (29.5%, a difference of 0.59%), Immigrants from Guyana (29.5%, a difference of 0.64%), British West Indian (29.7%, a difference of 1.5%), and Inupiat (29.9%, a difference of 1.9%).
| Demographics | Rating | Rank | No Vehicles in Household |
| Trinidadians and Tobagonians | 0.0 /100 | #331 | Tragic 23.7% |
| Immigrants | Ecuador | 0.0 /100 | #332 | Tragic 23.8% |
| Immigrants | Trinidad and Tobago | 0.0 /100 | #333 | Tragic 24.6% |
| Immigrants | Bangladesh | 0.0 /100 | #334 | Tragic 25.8% |
| Barbadians | 0.0 /100 | #335 | Tragic 26.1% |
| Vietnamese | 0.0 /100 | #336 | Tragic 26.2% |
| Immigrants | Uzbekistan | 0.0 /100 | #337 | Tragic 26.7% |
| Guyanese | 0.0 /100 | #338 | Tragic 29.3% |
| Dominicans | 0.0 /100 | #339 | Tragic 29.4% |
| Immigrants | Barbados | 0.0 /100 | #340 | Tragic 29.5% |
| Immigrants | Guyana | 0.0 /100 | #341 | Tragic 29.5% |
| British West Indians | 0.0 /100 | #342 | Tragic 29.7% |
| Inupiat | 0.0 /100 | #343 | Tragic 29.9% |
| Immigrants | Dominican Republic | 0.0 /100 | #344 | Tragic 31.4% |
| Immigrants | St. Vincent and the Grenadines | 0.0 /100 | #345 | Tragic 35.4% |
Demographics Similar to Arabs by No Vehicles in Household
In terms of no vehicles in household, the demographic groups most similar to Arabs are Ethiopian (10.5%, a difference of 0.060%), Immigrants from Colombia (10.5%, a difference of 0.16%), Immigrants from Bulgaria (10.5%, a difference of 0.20%), Native/Alaskan (10.5%, a difference of 0.22%), and Immigrants from Ethiopia (10.4%, a difference of 0.36%).
| Demographics | Rating | Rank | No Vehicles in Household |
| Filipinos | 50.1 /100 | #173 | Average 10.4% |
| Immigrants | Sudan | 50.0 /100 | #174 | Average 10.4% |
| Immigrants | Burma/Myanmar | 49.1 /100 | #175 | Average 10.4% |
| French American Indians | 49.1 /100 | #176 | Average 10.4% |
| Immigrants | El Salvador | 49.1 /100 | #177 | Average 10.4% |
| Immigrants | Ethiopia | 48.0 /100 | #178 | Average 10.4% |
| Ethiopians | 45.8 /100 | #179 | Average 10.5% |
| Arabs | 45.3 /100 | #180 | Average 10.5% |
| Immigrants | Colombia | 44.1 /100 | #181 | Average 10.5% |
| Immigrants | Bulgaria | 43.8 /100 | #182 | Average 10.5% |
| Natives/Alaskans | 43.7 /100 | #183 | Average 10.5% |
| Immigrants | Nepal | 42.4 /100 | #184 | Average 10.5% |
| South Americans | 41.9 /100 | #185 | Average 10.5% |
| German Russians | 40.6 /100 | #186 | Average 10.5% |
| Immigrants | Poland | 38.4 /100 | #187 | Fair 10.6% |