Albanian vs Guatemalan No Vehicles in Household
COMPARE
Albanian
Guatemalan
No Vehicles in Household
No Vehicles in Household Comparison
Albanians
Guatemalans
15.6%
NO VEHICLES IN HOUSEHOLD
0.0/ 100
METRIC RATING
314th/ 347
METRIC RANK
11.0%
NO VEHICLES IN HOUSEHOLD
16.1/ 100
METRIC RATING
204th/ 347
METRIC RANK
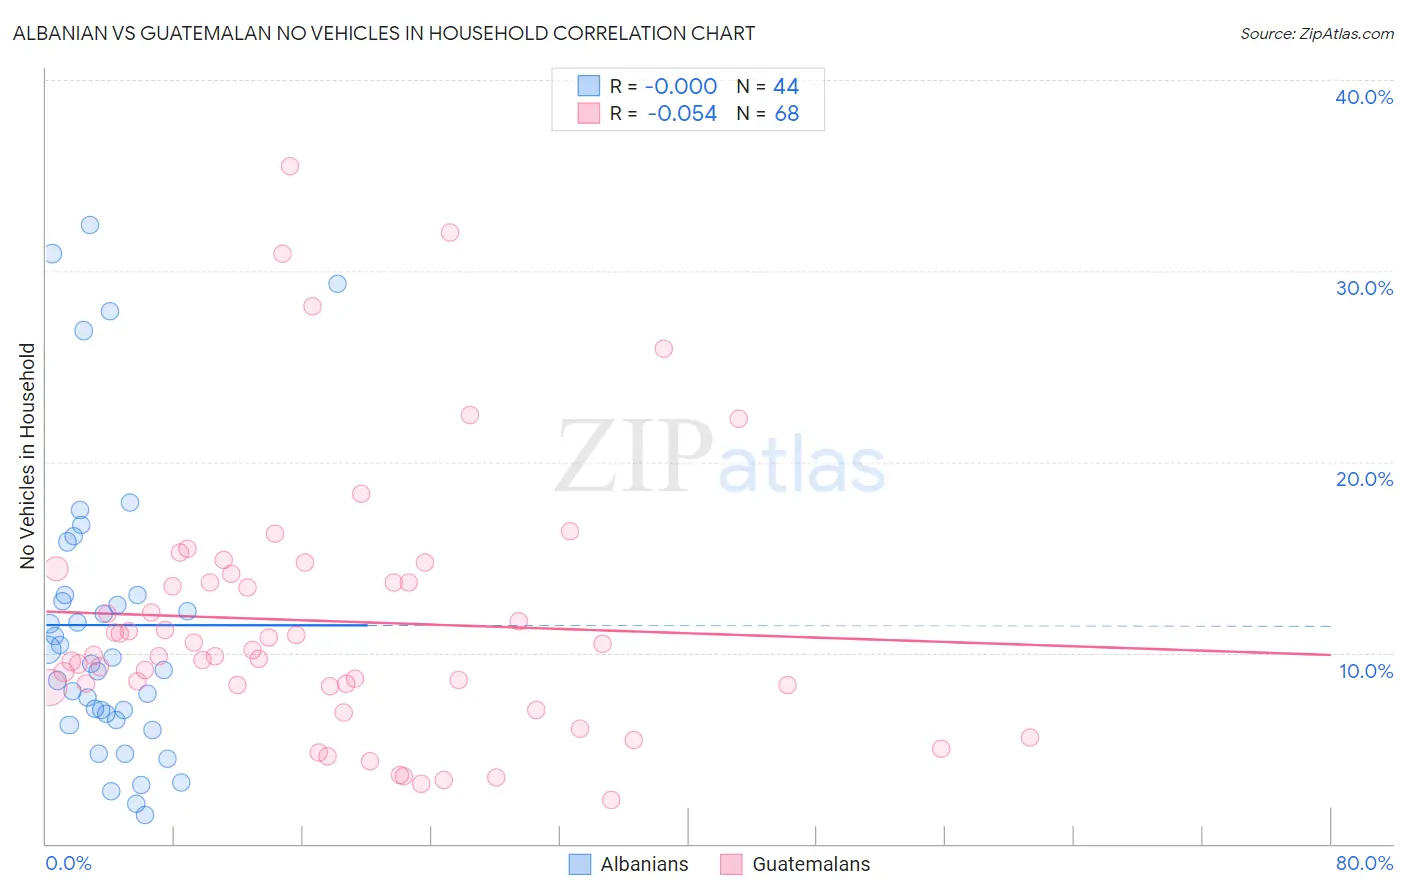
Albanian vs Guatemalan No Vehicles in Household Correlation Chart
The statistical analysis conducted on geographies consisting of 193,028,438 people shows no correlation between the proportion of Albanians and percentage of households with no vehicle available in the United States with a correlation coefficient (R) of -0.000 and weighted average of 15.6%. Similarly, the statistical analysis conducted on geographies consisting of 408,589,655 people shows a slight negative correlation between the proportion of Guatemalans and percentage of households with no vehicle available in the United States with a correlation coefficient (R) of -0.054 and weighted average of 11.0%, a difference of 42.4%.
No Vehicles in Household Correlation Summary
| Measurement | Albanian | Guatemalan |
| Minimum | 1.5% | 2.3% |
| Maximum | 32.4% | 35.5% |
| Range | 30.9% | 33.2% |
| Mean | 11.5% | 11.7% |
| Median | 9.6% | 10.0% |
| Interquartile 25% (IQ1) | 6.7% | 8.3% |
| Interquartile 75% (IQ3) | 13.0% | 13.9% |
| Interquartile Range (IQR) | 6.3% | 5.6% |
| Standard Deviation (Sample) | 7.7% | 6.9% |
| Standard Deviation (Population) | 7.6% | 6.8% |
Similar Demographics by No Vehicles in Household
Demographics Similar to Albanians by No Vehicles in Household
In terms of no vehicles in household, the demographic groups most similar to Albanians are Cypriot (15.7%, a difference of 0.13%), Tohono O'odham (15.6%, a difference of 0.16%), Alaskan Athabascan (15.6%, a difference of 0.31%), Immigrants from Israel (15.6%, a difference of 0.46%), and Cape Verdean (15.6%, a difference of 0.48%).
| Demographics | Rating | Rank | No Vehicles in Household |
| Immigrants | Haiti | 0.0 /100 | #307 | Tragic 15.4% |
| U.S. Virgin Islanders | 0.0 /100 | #308 | Tragic 15.4% |
| Puerto Ricans | 0.0 /100 | #309 | Tragic 15.5% |
| Cape Verdeans | 0.0 /100 | #310 | Tragic 15.6% |
| Immigrants | Israel | 0.0 /100 | #311 | Tragic 15.6% |
| Alaskan Athabascans | 0.0 /100 | #312 | Tragic 15.6% |
| Tohono O'odham | 0.0 /100 | #313 | Tragic 15.6% |
| Albanians | 0.0 /100 | #314 | Tragic 15.6% |
| Cypriots | 0.0 /100 | #315 | Tragic 15.7% |
| Ghanaians | 0.0 /100 | #316 | Tragic 16.4% |
| Immigrants | Ghana | 0.0 /100 | #317 | Tragic 16.6% |
| Immigrants | Belarus | 0.0 /100 | #318 | Tragic 16.7% |
| Alaska Natives | 0.0 /100 | #319 | Tragic 17.4% |
| Soviet Union | 0.0 /100 | #320 | Tragic 17.4% |
| Jamaicans | 0.0 /100 | #321 | Tragic 17.9% |
Demographics Similar to Guatemalans by No Vehicles in Household
In terms of no vehicles in household, the demographic groups most similar to Guatemalans are Immigrants from Chile (11.0%, a difference of 0.040%), Somali (11.0%, a difference of 0.050%), Sierra Leonean (11.0%, a difference of 0.10%), Immigrants from Italy (11.0%, a difference of 0.11%), and Pennsylvania German (11.0%, a difference of 0.14%).
| Demographics | Rating | Rank | No Vehicles in Household |
| Shoshone | 24.1 /100 | #197 | Fair 10.8% |
| Immigrants | Sweden | 22.9 /100 | #198 | Fair 10.8% |
| Immigrants | Asia | 21.3 /100 | #199 | Fair 10.9% |
| Cambodians | 19.6 /100 | #200 | Poor 10.9% |
| Immigrants | Western Europe | 19.1 /100 | #201 | Poor 10.9% |
| Romanians | 17.9 /100 | #202 | Poor 10.9% |
| Iroquois | 17.6 /100 | #203 | Poor 10.9% |
| Guatemalans | 16.1 /100 | #204 | Poor 11.0% |
| Immigrants | Chile | 15.9 /100 | #205 | Poor 11.0% |
| Somalis | 15.9 /100 | #206 | Poor 11.0% |
| Sierra Leoneans | 15.7 /100 | #207 | Poor 11.0% |
| Immigrants | Italy | 15.6 /100 | #208 | Poor 11.0% |
| Pennsylvania Germans | 15.5 /100 | #209 | Poor 11.0% |
| Apache | 14.8 /100 | #210 | Poor 11.0% |
| Crow | 14.2 /100 | #211 | Poor 11.0% |