Ethiopian vs Immigrants from Haiti 1 or more Vehicles in Household
COMPARE
Ethiopian
Immigrants from Haiti
1 or more Vehicles in Household
1 or more Vehicles in Household Comparison
Ethiopians
Immigrants from Haiti
89.6%
1 OR MORE VEHICLES IN HOUSEHOLD
41.2/ 100
METRIC RATING
183rd/ 347
METRIC RANK
84.7%
1 OR MORE VEHICLES IN HOUSEHOLD
0.0/ 100
METRIC RATING
309th/ 347
METRIC RANK
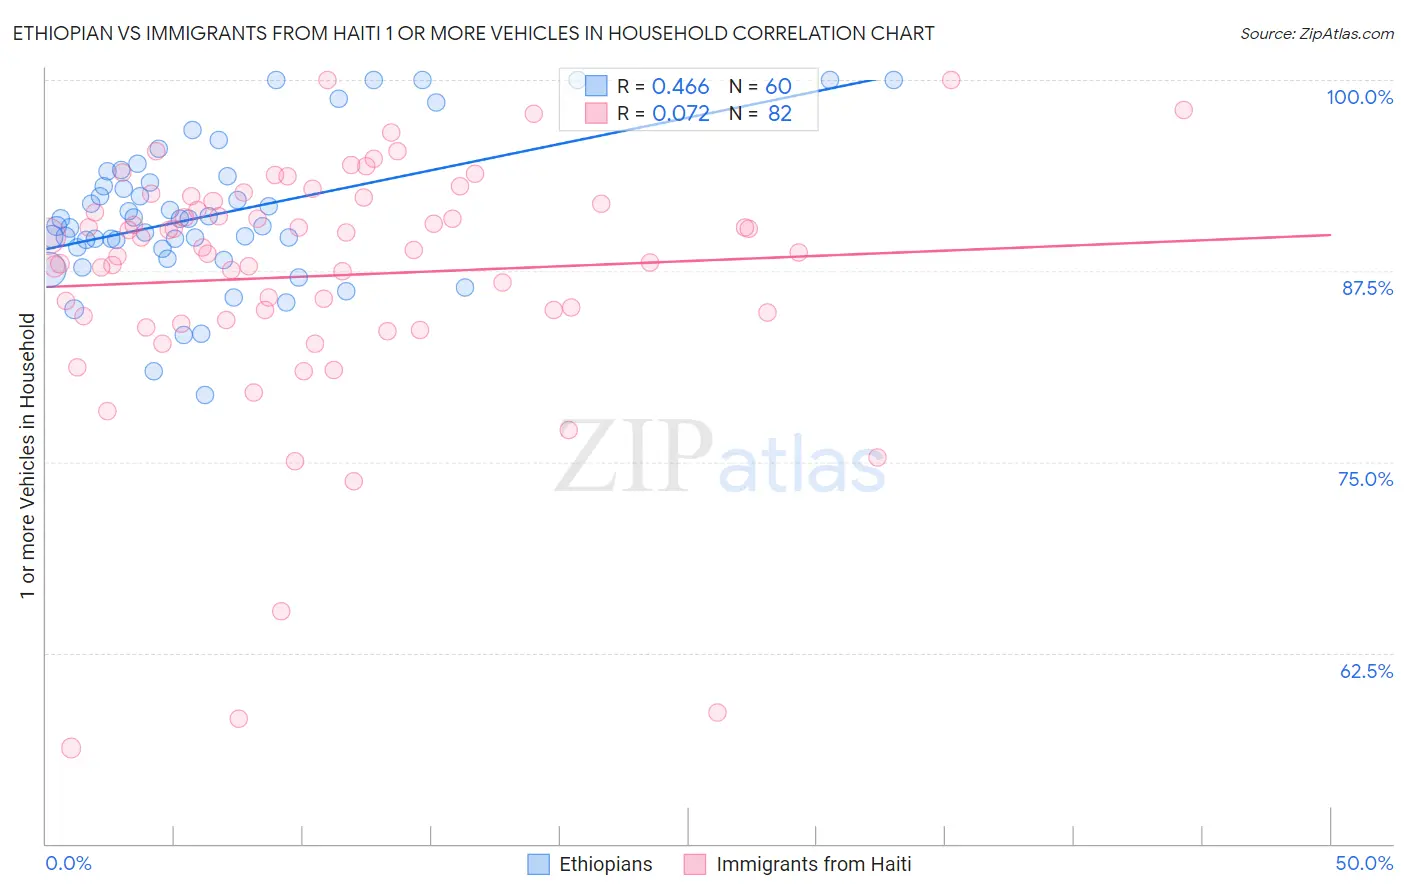
Ethiopian vs Immigrants from Haiti 1 or more Vehicles in Household Correlation Chart
The statistical analysis conducted on geographies consisting of 223,130,075 people shows a moderate positive correlation between the proportion of Ethiopians and percentage of households with 1 or more vehicles available in the United States with a correlation coefficient (R) of 0.466 and weighted average of 89.6%. Similarly, the statistical analysis conducted on geographies consisting of 225,185,798 people shows a slight positive correlation between the proportion of Immigrants from Haiti and percentage of households with 1 or more vehicles available in the United States with a correlation coefficient (R) of 0.072 and weighted average of 84.7%, a difference of 5.8%.
1 or more Vehicles in Household Correlation Summary
| Measurement | Ethiopian | Immigrants from Haiti |
| Minimum | 79.4% | 56.3% |
| Maximum | 100.0% | 100.0% |
| Range | 20.6% | 43.7% |
| Mean | 91.2% | 87.2% |
| Median | 90.7% | 88.9% |
| Interquartile 25% (IQ1) | 89.0% | 84.5% |
| Interquartile 75% (IQ3) | 93.5% | 92.1% |
| Interquartile Range (IQR) | 4.5% | 7.5% |
| Standard Deviation (Sample) | 4.7% | 8.3% |
| Standard Deviation (Population) | 4.7% | 8.3% |
Similar Demographics by 1 or more Vehicles in Household
Demographics Similar to Ethiopians by 1 or more Vehicles in Household
In terms of 1 or more vehicles in household, the demographic groups most similar to Ethiopians are Immigrants from Bulgaria (89.6%, a difference of 0.010%), Immigrants from Ethiopia (89.6%, a difference of 0.020%), Ukrainian (89.6%, a difference of 0.020%), Immigrants from Brazil (89.6%, a difference of 0.020%), and Pueblo (89.6%, a difference of 0.020%).
| Demographics | Rating | Rank | 1 or more Vehicles in Household |
| Immigrants | Sudan | 47.1 /100 | #176 | Average 89.7% |
| Hmong | 45.8 /100 | #177 | Average 89.6% |
| Immigrants | El Salvador | 44.1 /100 | #178 | Average 89.6% |
| German Russians | 44.0 /100 | #179 | Average 89.6% |
| Arabs | 43.3 /100 | #180 | Average 89.6% |
| Immigrants | Ethiopia | 42.5 /100 | #181 | Average 89.6% |
| Ukrainians | 42.4 /100 | #182 | Average 89.6% |
| Ethiopians | 41.2 /100 | #183 | Average 89.6% |
| Immigrants | Bulgaria | 40.7 /100 | #184 | Average 89.6% |
| Immigrants | Brazil | 40.1 /100 | #185 | Average 89.6% |
| Pueblo | 39.9 /100 | #186 | Fair 89.6% |
| South Americans | 39.6 /100 | #187 | Fair 89.5% |
| Immigrants | Nepal | 38.9 /100 | #188 | Fair 89.5% |
| Carpatho Rusyns | 37.8 /100 | #189 | Fair 89.5% |
| Shoshone | 37.5 /100 | #190 | Fair 89.5% |
Demographics Similar to Immigrants from Haiti by 1 or more Vehicles in Household
In terms of 1 or more vehicles in household, the demographic groups most similar to Immigrants from Haiti are Immigrants from Belize (84.7%, a difference of 0.010%), U.S. Virgin Islander (84.6%, a difference of 0.030%), Tohono O'odham (84.7%, a difference of 0.040%), Puerto Rican (84.6%, a difference of 0.070%), and Cape Verdean (84.5%, a difference of 0.18%).
| Demographics | Rating | Rank | 1 or more Vehicles in Household |
| Moroccans | 0.0 /100 | #302 | Tragic 85.4% |
| Immigrants | Greece | 0.0 /100 | #303 | Tragic 85.4% |
| Immigrants | Ukraine | 0.0 /100 | #304 | Tragic 85.2% |
| Immigrants | China | 0.0 /100 | #305 | Tragic 84.9% |
| Immigrants | Western Africa | 0.0 /100 | #306 | Tragic 84.9% |
| Tohono O'odham | 0.0 /100 | #307 | Tragic 84.7% |
| Immigrants | Belize | 0.0 /100 | #308 | Tragic 84.7% |
| Immigrants | Haiti | 0.0 /100 | #309 | Tragic 84.7% |
| U.S. Virgin Islanders | 0.0 /100 | #310 | Tragic 84.6% |
| Puerto Ricans | 0.0 /100 | #311 | Tragic 84.6% |
| Cape Verdeans | 0.0 /100 | #312 | Tragic 84.5% |
| Immigrants | Israel | 0.0 /100 | #313 | Tragic 84.5% |
| Albanians | 0.0 /100 | #314 | Tragic 84.4% |
| Cypriots | 0.0 /100 | #315 | Tragic 84.4% |
| Alaska Natives | 0.0 /100 | #316 | Tragic 83.8% |